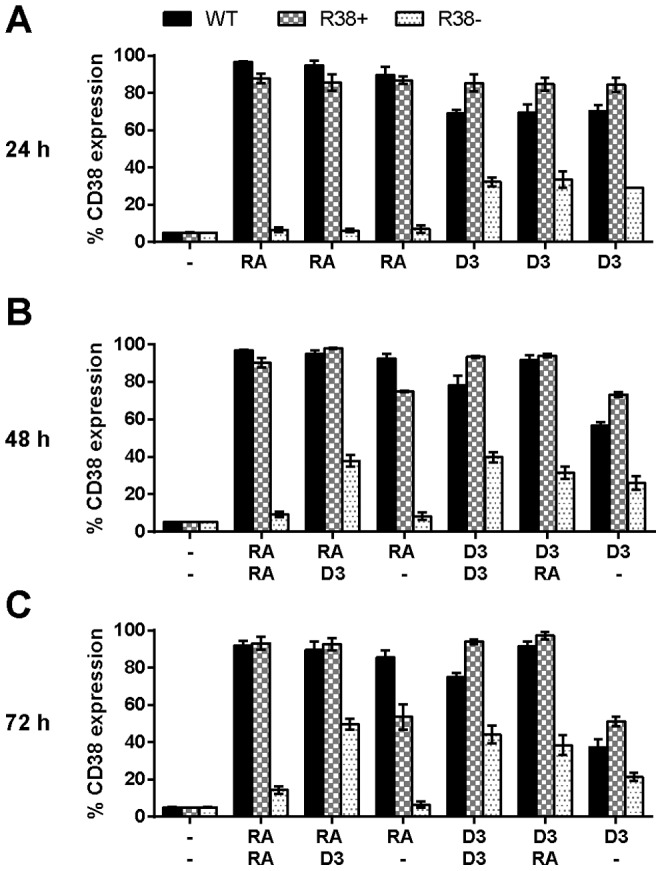
Figure 1. Percentage of cells expressing CD38 for WT HL-60 and R38+ and R38- RA-resistant HL-60 cells.

D3 increases the early differentiation marker CD38 in RA-resistant HL-60 cell lines. (A) 24 h CD38 expression (after treatment with one inducing agent). (B) 48 h CD38 expression after sequential treatment with two inducing agents during the precommitment and lineage-commitment phases (RA/RA, RA/D3, RA/-, D3/D3, D3/RA, and D3/-). (C) 72 h CD38 expression (continuation of treatment with second inducing agent). CD38 expression was assessed by flow cytometry at 24, 48 and 72 h after first treatment initialization. Gates to determine percent increase of expression with treatment were set to exclude 95% of the control population. For clarity, p-values are not indicated above bars due to the existence of multivariate comparison between cell lines, treatments, and time. However, p-values of interest are mentioned specifically in the main text.
