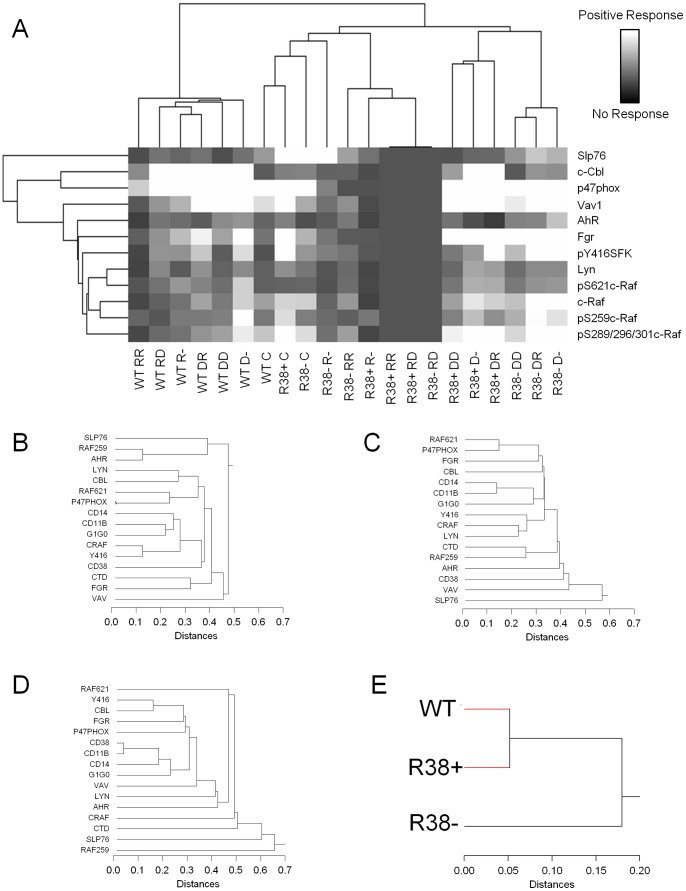
Figure 8. Clustering analysis.
(A) Agglomerative hierarchical clustering analysis was performed on average quantified Western blot data (signaling protein data only) using Cluster 3.0 and visualized with TreeView. The distance metric was Pearson's correlation coefficient. In the diagram, RR = RA/RA, RD = RA/D3, R- = RA/-, DD = D3/D3, DR = D3/RA, and D- = D3/-. (B-E). Clustering analysis across all treatment cases and all results (cytometry phenotyping data and Western blot signaling protein data) was performed using SYSTAT 8.0. In B-E, CTD refers to pS289/296/301c-Raf. (B) Clustering for WT HL-60. (C) Clustering for R38+. (D) Clustering for R38−. (E) WT and R38+ cluster more closely to each other than to R38− HL-60 cells.

