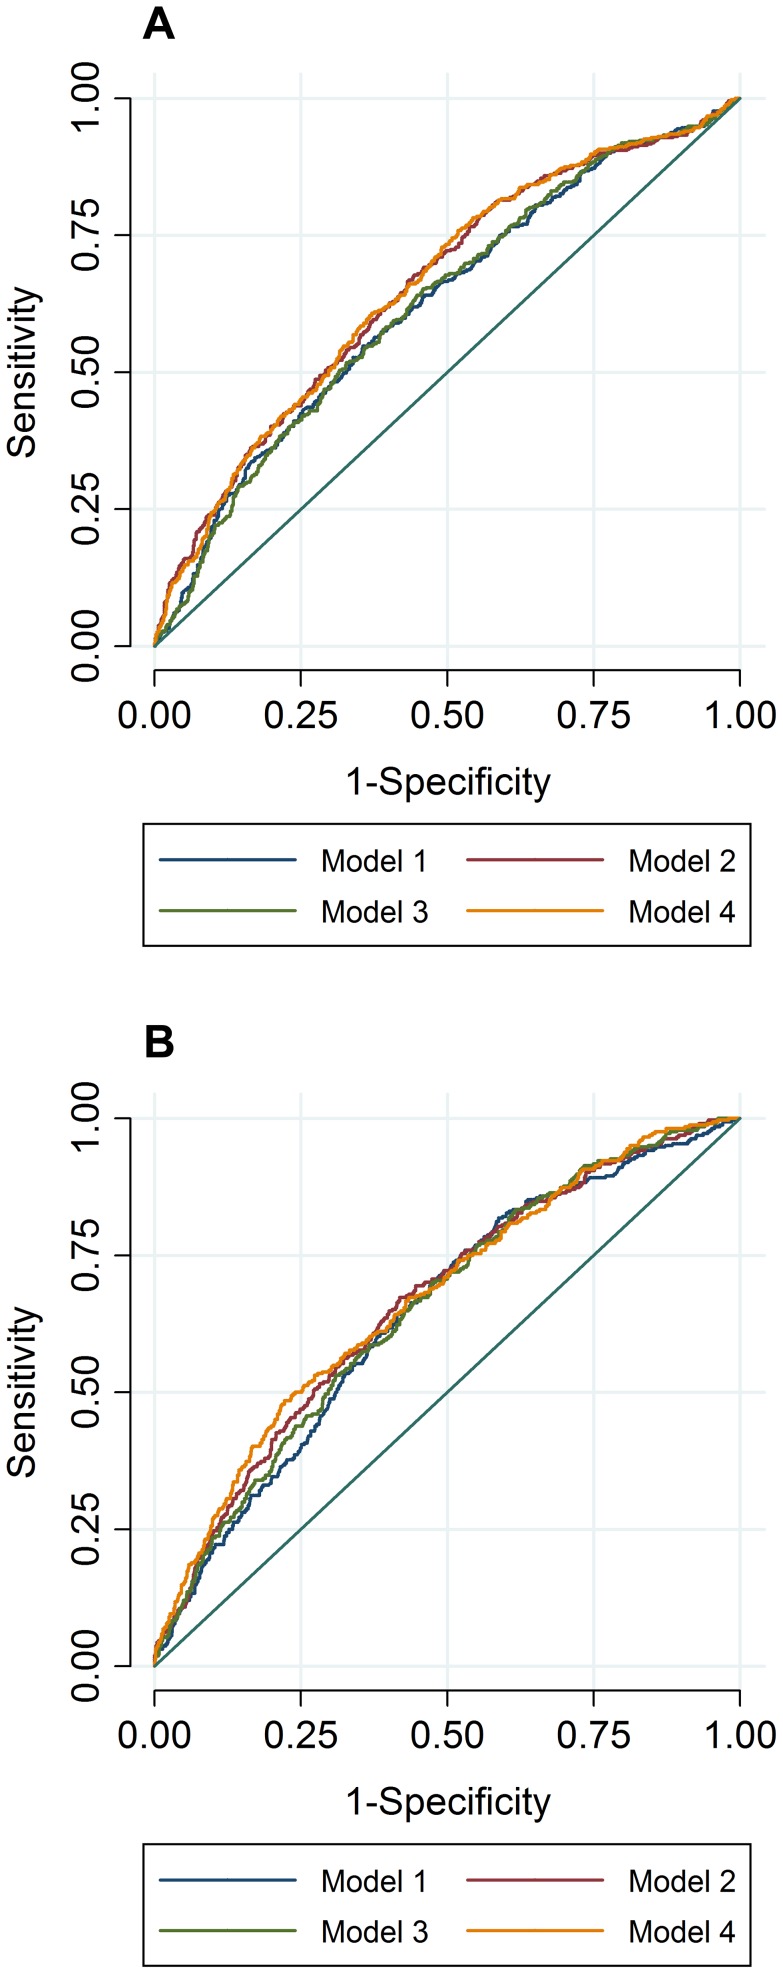
Figure 2. ROC AUC for high TC (A) and high TG (B) at follow-up.
In ROC analyses we excluded individuals with hyperlipidemia at baseline and compared the predictive accuracy of four models (age, sex and BMI (Model 1), Model 1 + trait specific wGRS (Model 2), Model 1 + traditional risk factors for hyperlipidemia (Model 3) and M1 + trait specific GRS + traditional risk factors for hyperlipidemia (Model 4)) in relation to hyperlipidemia at follow-up.

