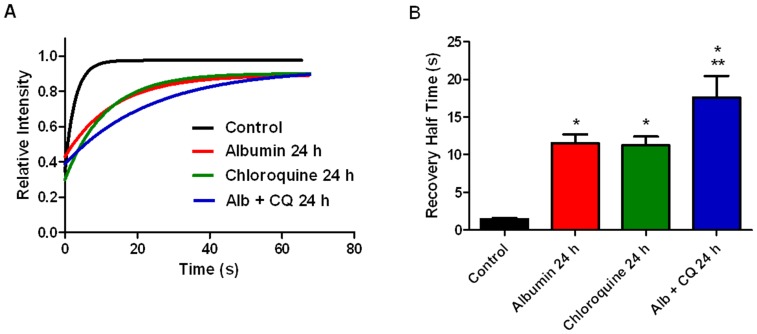
Figure 4. Prolonged exposure of podocytes to albumin and chloroquine decreased lysosome activity.
Lysosome activity in living podocytes was determined by fluorescence recovery after photobleaching (FRAP). Using confocal microscopy, regions of interest containing individual lysosomes were isolated and photobleached. Exponential curves of the recovery of fluorescence intensity, which represents cathepsin B activity, were obtained. A) Representative recovery curves for control (black), 24 h albumin exposed (red), 24 h chloroquine exposed (green), and podocytes exposed to both albumin and chloroquine for 24 h (blue). B) Bar graph of recovery half times (mean +/− SEM), which are inversely related to cathepsin B activity. Cathepsin B activity was decreased in 24 h chloroquine (n = 10) and 24 h albumin (n = 10) exposed podocytes compared to control (n = 10), *p<0.05. Cathepsin B activity decreased further in podocytes exposed to both albumin and chloroquine for 24 h (n = 10) compared to each exposure alone, **p<0.05.

