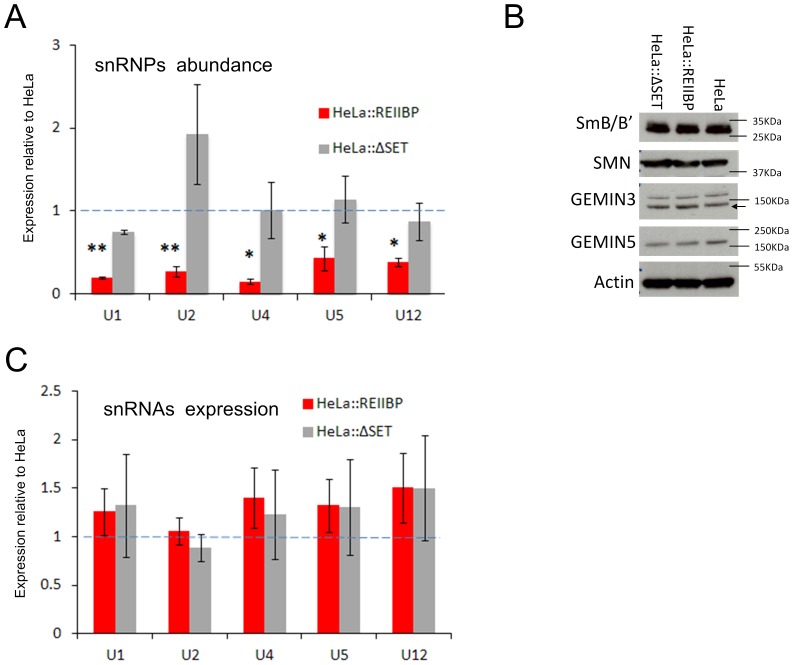
Figure 3. REIIBP SET domain controls spliceosomal snRNPs abundance.
A) Cellular snRNPs abundance. snRNPs were immunoprecipitated with anti SmB/B′ antibody, snRNAs were purified, reverse transcribed and quantified by qPCR, (compared to the level of βactin mRNA present in the input). Each analysis is an average of three independent IPs. B) SMN complex components and SmB/B′ protein levels. Total cell lysates were immunoblotted against the relative antibodies. The black arrow indicates GEMIN3 specific bands. c) snRNAs expression analysis. qRT-PCR of total RNA. Each value is an average of three independent analysis. Figures A and C are expressed relative to control (HeLa cells, dotted line). The error bars are the SEM. ** p value <0.006, * p value <0.05.

