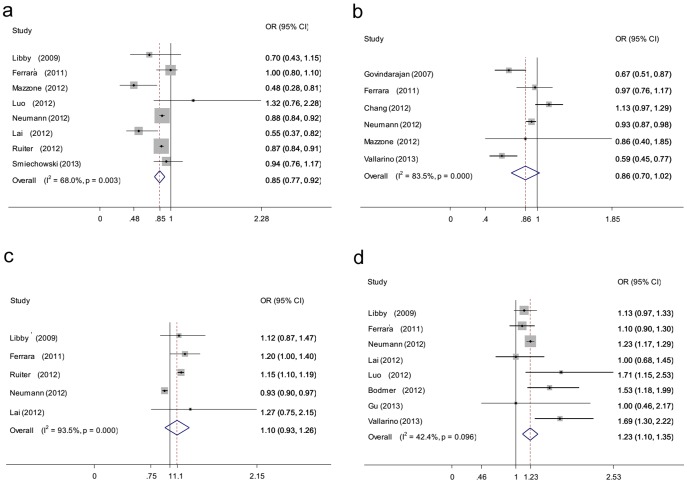
Figure 2. Forest plot of hypoglycaemic agents and the risk of lung cancer in patients with diabetes.
a: metformin; b:thiazolidinediones (TZDs); c:sulfonylureas; d:insulin. The squares and horizontal lines correspond to the study-specific OR and 95% CI. The area of the squares reflects the weight (inverse of the variance). The diamond represents the summary OR and 95% CI.

