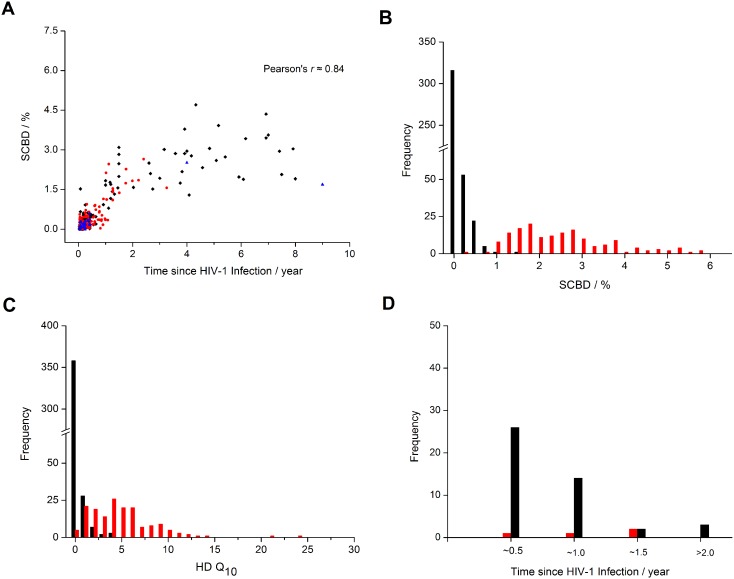
Figure 2. The SCBD dynamics and distribution of D561.
(A) The SCBD dynamics in D561. Black diamonds denote subtype B samples, red dots denote subtype C samples, and blue triangles denote samples with other or unknown subtypes. (B) The distribution of the SCBD values in D561. The black histogram denotes the 398 incident infections (including 295 single- and 103 multiple-strain infections), and the red represents the other 163 chronic samples. (C) The distribution of the HD Q10 values in D561. (D) The red histogram represents the 4 misclassified samples by our SCBD method, including 2 false positive incident infections and 2 false negatives; the black histogram denotes the 45 misclassified samples by the HD Q10 method, including 5 false positives and 40 false negatives.

