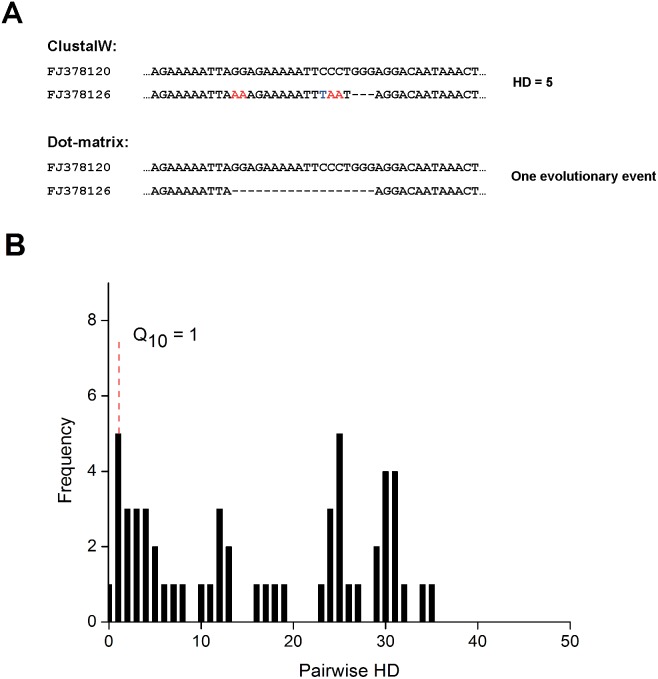
Figure 3. Partial alignment of two sequences from sample ID 1811 (A), along with the sample’s pairwise HD distribution (B).
(A) Partial alignment of two sequences from sample ID 1811. Red and blue letters highlight differences in nucleotides. (B) The pairwise HD distribution of sequences from sample ID 1811, which was misclassified as a chronic case by the HD Q10 assay (HD Q10 = 1). The sample comprised of 11 sequences and was obtained at Fiebig stage VI.

