
Figure 2. Relation between number of viewshed points, road density and urban ratio.
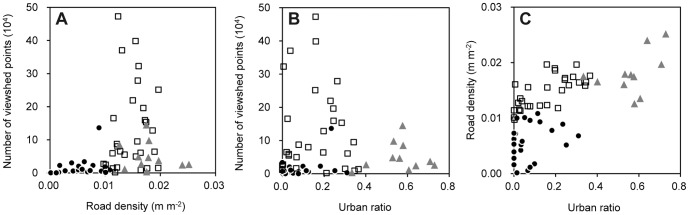
Road density and urban ratio represent the total length of road line for 500(m m−2) and the proportion of urban area for a 500 m buffer area, respectively, for 64 agricultural ponds in Hyogo Prefecture, Japan. Closed circles, open squares, and grayed triangles represent dominant land use types for 500 m buffer areas corresponding respectively to woodland, paddy field, and urban areas.