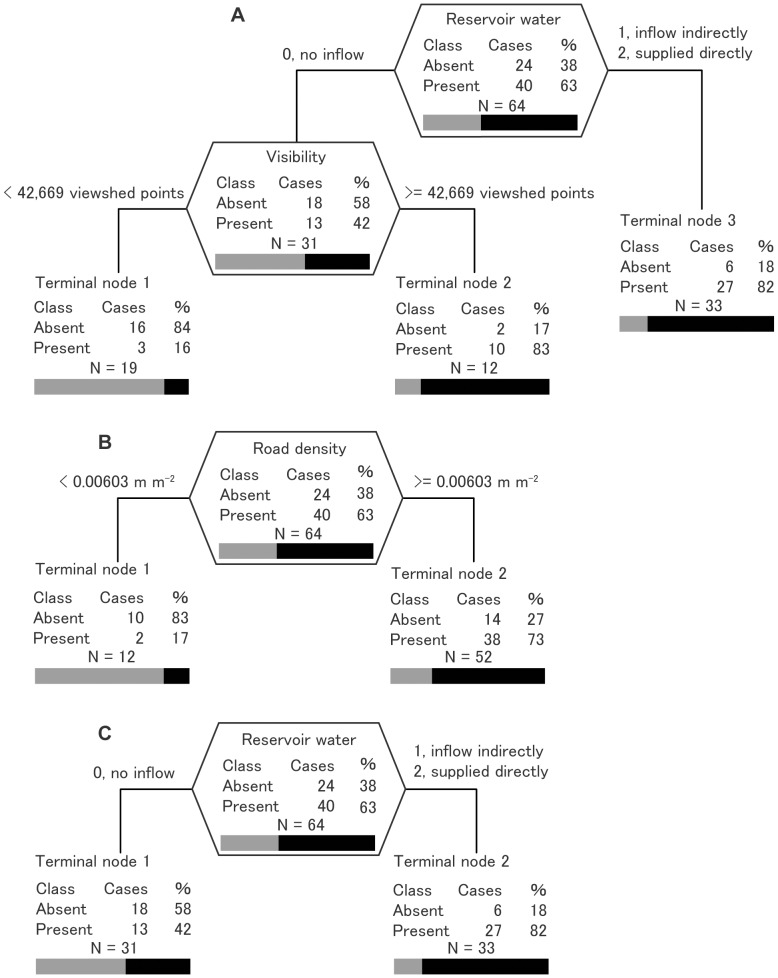
Figure 3. Results of classification tree analysis of the probability of Bluegill (Lepomis macrochirus) presence.
The optimal tree is shown, which includes (A) visibility, (B) road density, and (C) urban ratio as a surrogate indicator for human-mediated introduction. %, percentage of cases for each class; bars represent the percentage of absent [gray] and present [black]. Although the urban ratio was included among environmental factors, the classification tree procedure omitted the variable from the optimal tree because of its lack of significance (C). The splitting variable name and split criterion are given for each node. The vertical depth of each node is proportional to its improvement value.

