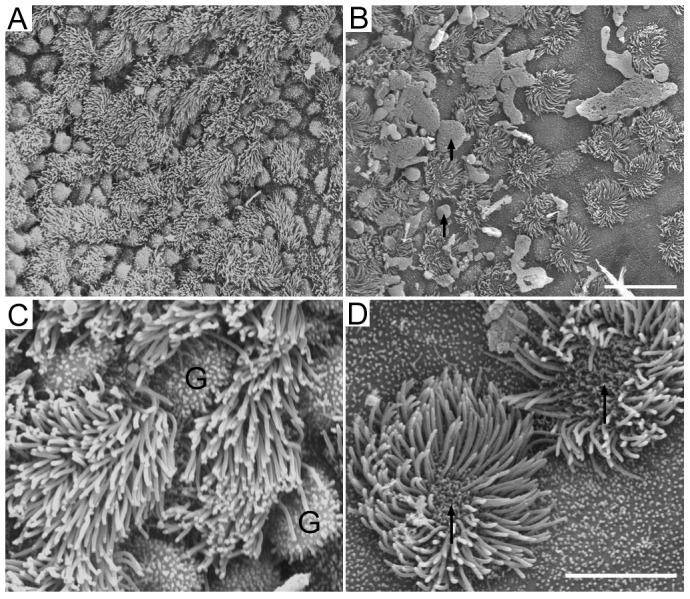
Figure 2. SEM pictures of ciliated epithelium near the pharyngeal opening (A) and tympanic opening (B) of the ET from a P30 gerbil.

Note that the density of ciliated cells near the pharyngeal opening is significantly greater than that near the tympanic opening. Black arrows indicate mucus drops. Bar: 15 µm for panels A and B. C: High magnification picture of ciliated cells and goblet cells in the area near the pharyngeal opening. G stands for goblet cells. D: High magnification picture of ciliated cells and squamous cells in the area near the tympanic opening. Note that there was absorption of cilia (marked by black arrows). Bar: 5 µm for C and D.
