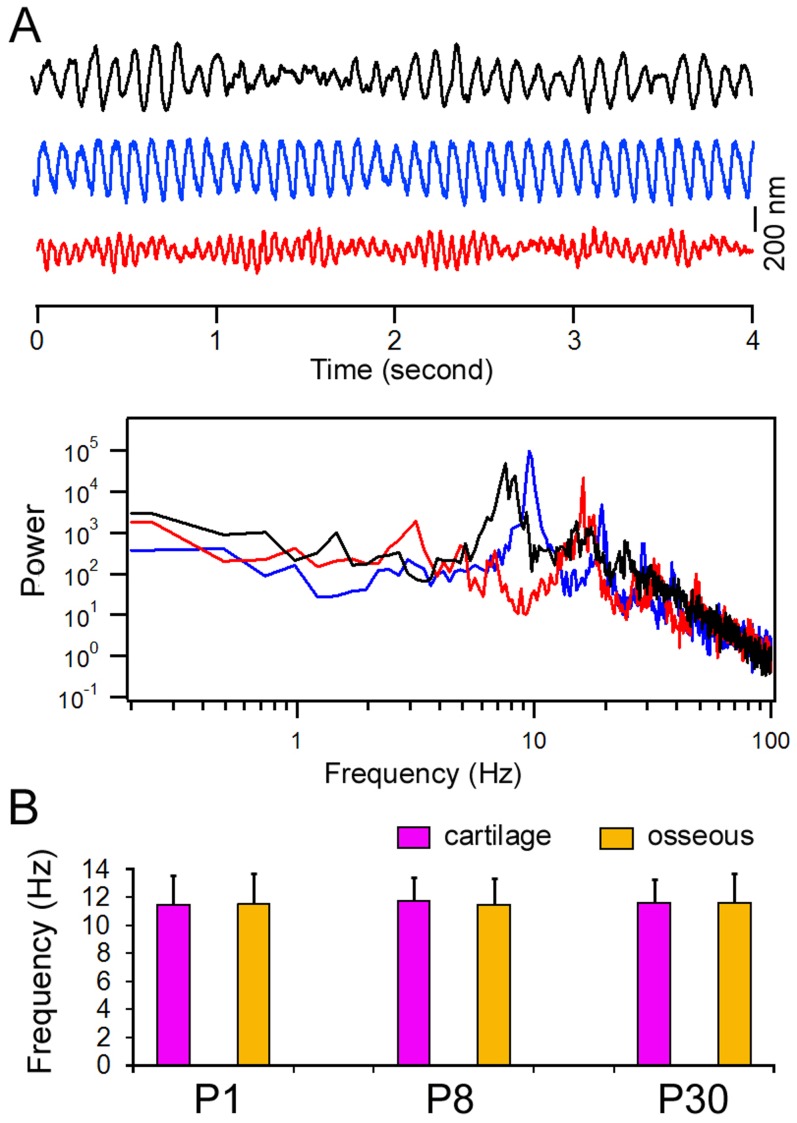
Figure 6. Spontaneous ciliary activity during development.
A: Three representative waveforms of spontaneous ciliary motion measured from ciliated cells near the pharyngeal opening using a photodiode-based displacement measurement system. The responses were obtained from three different cells at P1. B: The power spectra of ciliary motion of the waveforms shown in Panel A. C: Means and SD of beat frequencies during different stages of development. The means are based on measurements made from 12 cells from three animals for each age group.

