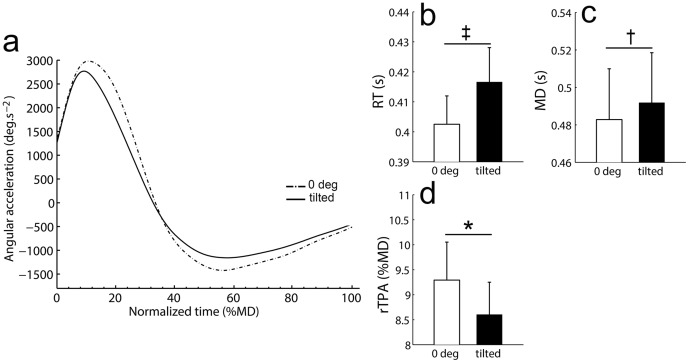
Figure 5. Movement pattern relative to orientation (0 deg vs. tilted).
a) Typical normalized acceleration profile relative to MD as a function of orientation (mean of all conditions). Differences in planned comparisons between tilted vs. 0 deg orientations were provided on the right panel for rTPA (b), RT (c), and MD (d). Vertical bars denote positive standard errors. *: p<.05; ‡: p<.01; †: p<.001.

