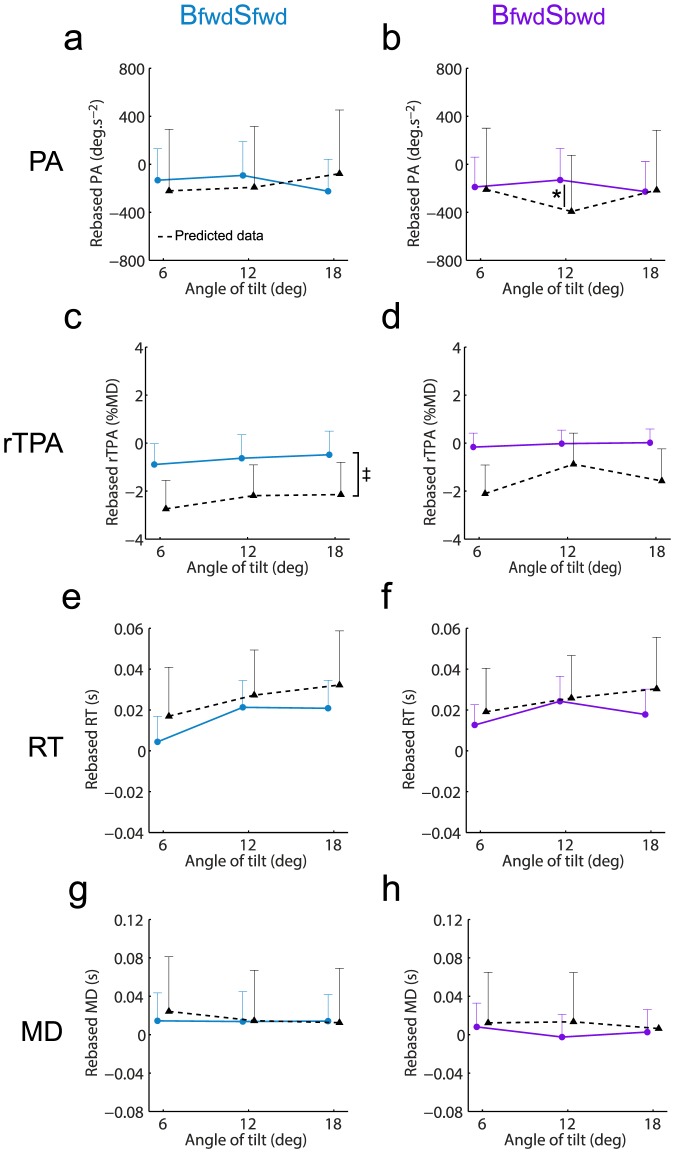
Figure 7. Kinematic parameters observed in combined conditions (solid lines) and associated predicted data (black dotted line) by the body-centered model.
Observed and predicted data for PA (a,b), rTPA (c,d), RT (e,f) and MD (g,h) were provided for both combined conditions (left panel: BfwdSfwd; right panel BfwdSbwd). Vertical bars denote positive standard errors. The lines between conditions depict differences at a given angle and the bracket depicts an overall difference between conditions (i.e., effect of data type without interaction data type x angle of tilt). *: p<.05; ‡: p<.01; †: p<.001.

