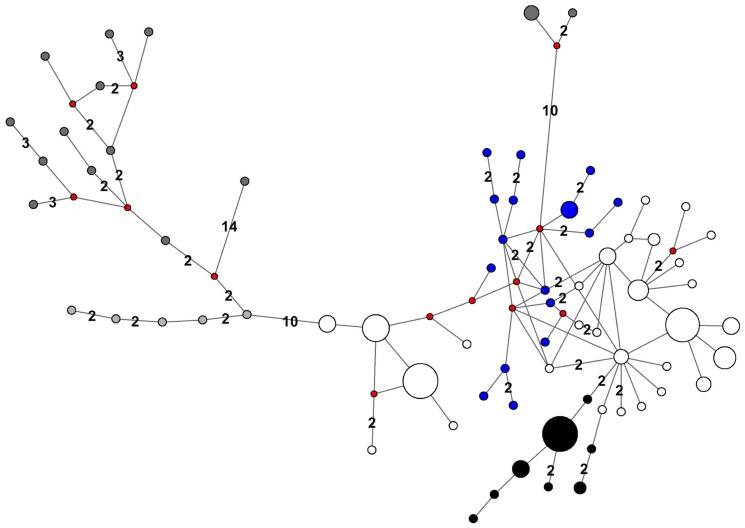
Figure 9. Median joining network of walrus haplotypes from PAC (dark gray), LAP (light gray), ATL (white) and MAR (black) regions as found in Lindqvist et al. [2] and this study.
In addition, ATL samples from east of Greenland are indicated in blue. Each line segment denotes one sequence difference, except where numbers indicate differences between more divergent sequences. The circle sizes are indicative of haplotype frequencies across the two studies. Small red circles indicate inferred median vectors.

