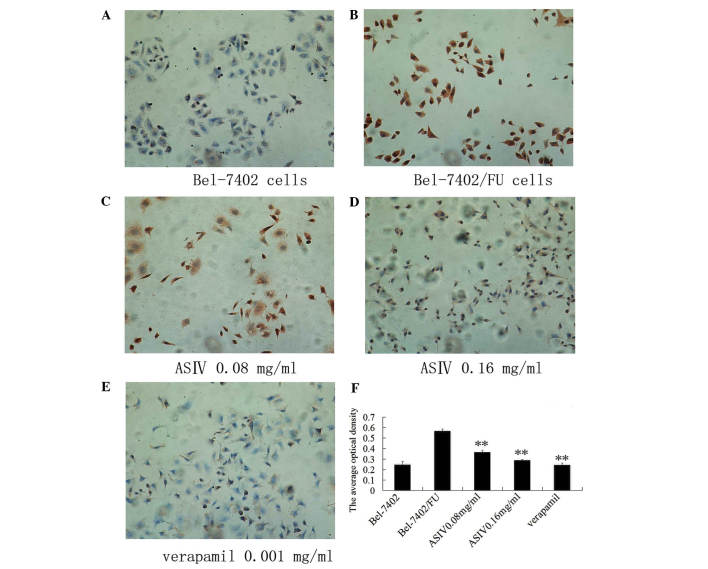
Figure 3.
Effect of ASIV on P-glycoprotein by immunocytochemistry assay. Cells were viewed under a fluorescence microscope, magnification, ×400. (A) Bel-7402 cells. (B) Bel-7402/FU cells. (C) Bel-7402/FU cells were treated with 0.08 mg/ml ASIV. (D) Bel-7402/FU cells were treated with 0.16 mg/ml ASIV.(E) Bel-7402/FU cells were treated with 0.001 mg/ml verapamil. Every image was captured by fluorescence microscopy (magnification, ×400) from at least five fields of view. (F) The values of the average optical density were determined using IMAGE-PRO plus image analysis software. Data are the mean ± standard deviation of three independent experiments. **P<0.01, modulator- treated Bel-7402/FU cells vs. untreated Bel-7402/FU cells. ASIV, astragaloside IV.

