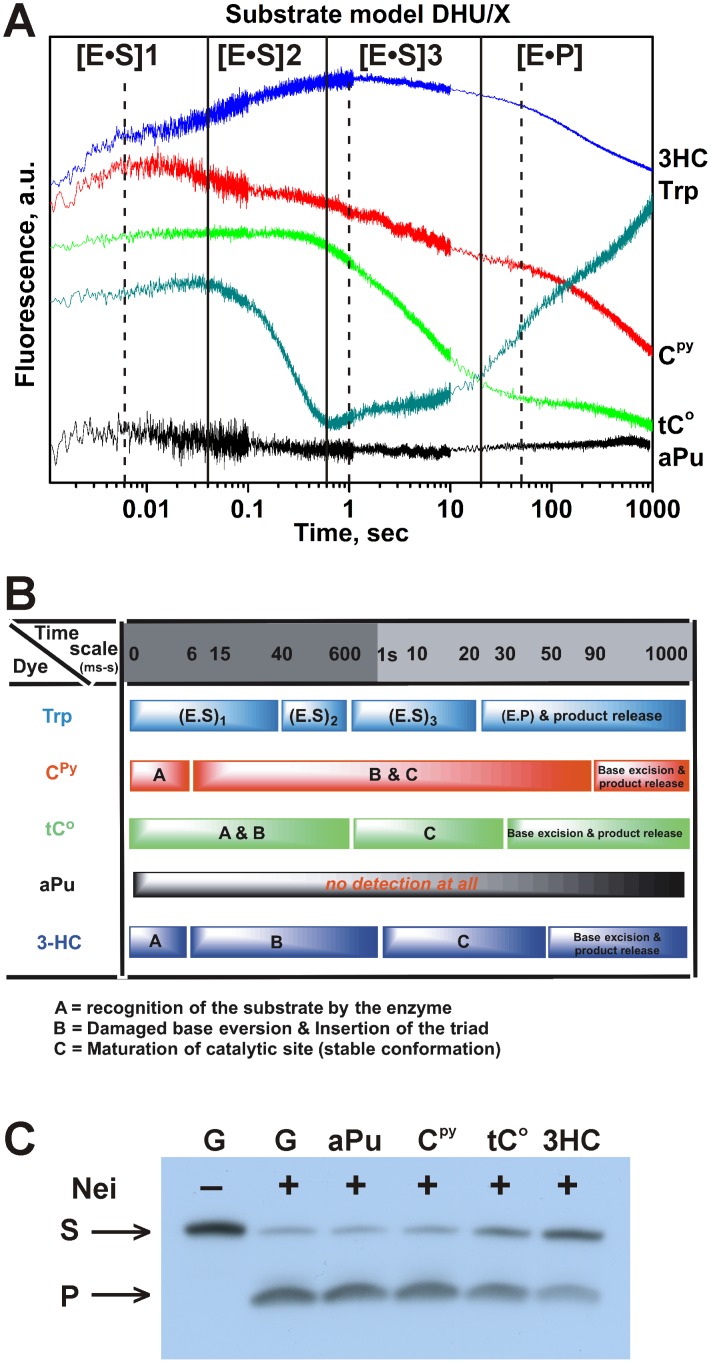
Figure 8. Interaction of Nei with DHU/X-substrates.
(A) Changes in Trp, aPu, Cpy, tCO and 3HC fluorescence intensity during the interaction of 2 µM Nei and 1 µM DNA substrates, containing fluorescent nucleotides opposite the damaged nucleotide. The emission of the long-wavelength T* band (495 long wavelength pass filter) of 3HC dye is presented. The black vertical lines delimit the 4 kinetic steps of protein dynamics following Trp fluorescence. The dashed black vertical lines delimit the 4 kinetic steps of DNA dynamics following 3HC fluorescence. (B) Summary of the different steps detected by the different fluorescent reporters used in this study. (C) Effect of the fluorescent labels on the enzymatic activity of Nei. The concentrations of Nei and DNA substrates were 2 µM and 1 µM, respectively.

