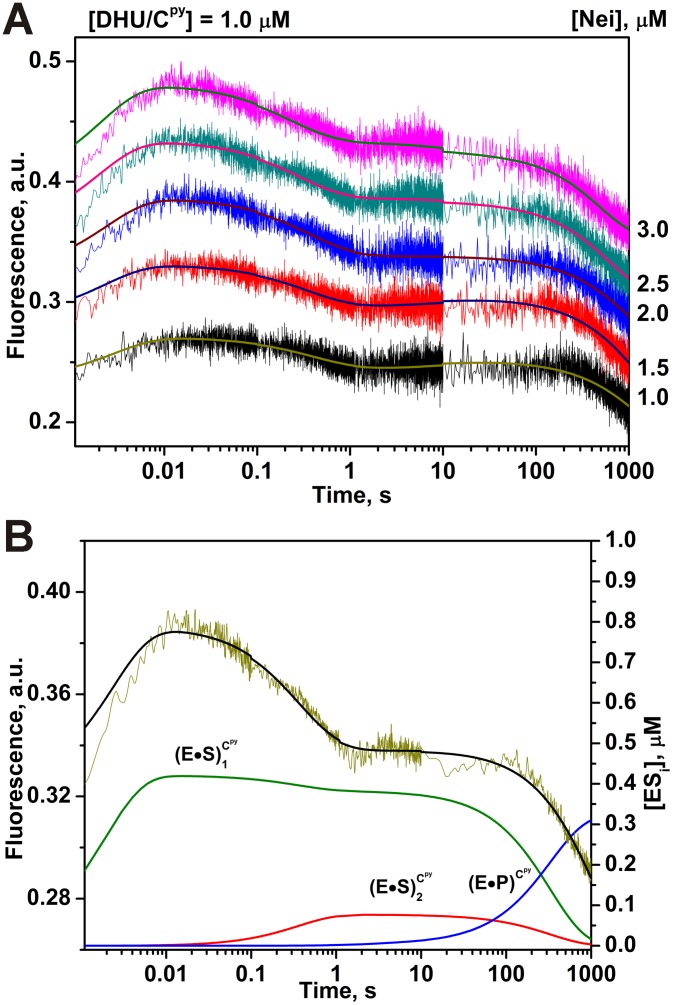
Figure 9. Interaction of Nei with DHU/Cpy-substrate.
(A) Changes in Cpy fluorescence intensity during the interaction of Nei with DHU/Cpy-substrate. Jagged traces show the experimental data, smooth curves correspond to the fit of the data to the kinetic model (Fig. 10). Concentrations of the DNA are shown next to the plots. (B) Time-course of appearance and disappearance of transient enzyme–substrate complexes during the cleavage of DHU/Cpy by Nei. Modeling was done for 2 µM Nei and 1 µM substrate with the rate constants listed in Table 2.

