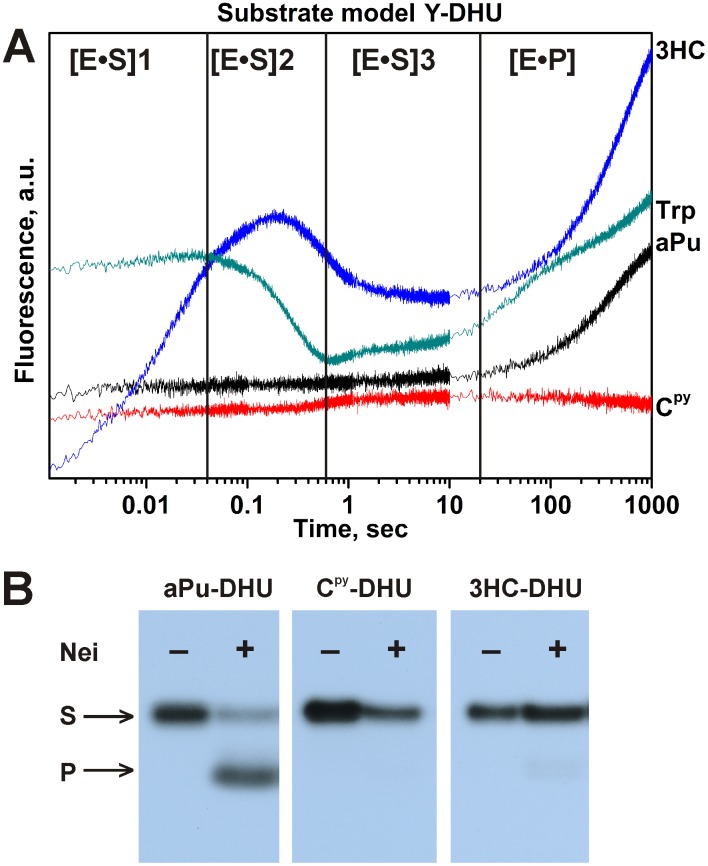
Figure 14. Interaction of Nei with Y-DHU-substrates.
The changes in Trp, aPu, Cpy and 3HC fluorescence intensity during the interaction of Nei with DNA substrates, containing fluorescent nucleotides on the 5′-side of the damaged nucleotide. The emission of the long-wavelength T* band (495nm long pass filter) of 3HC dye is presented. The black vertical lines delimit the 4 kinetic steps of protein dynamics following Trp fluorescence. (B) The effect of the fluorescent labels on the enzymatic activity of Nei. The concentrations of Nei and DNA substrates were 2 µM and 1 µM, respectively.

