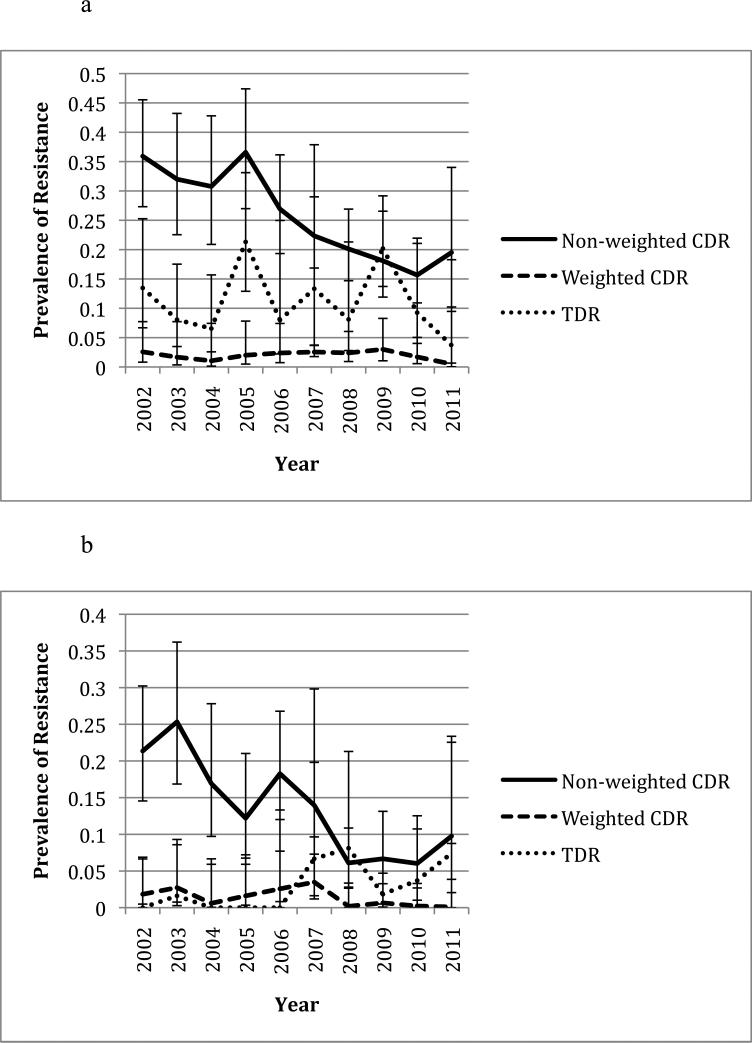
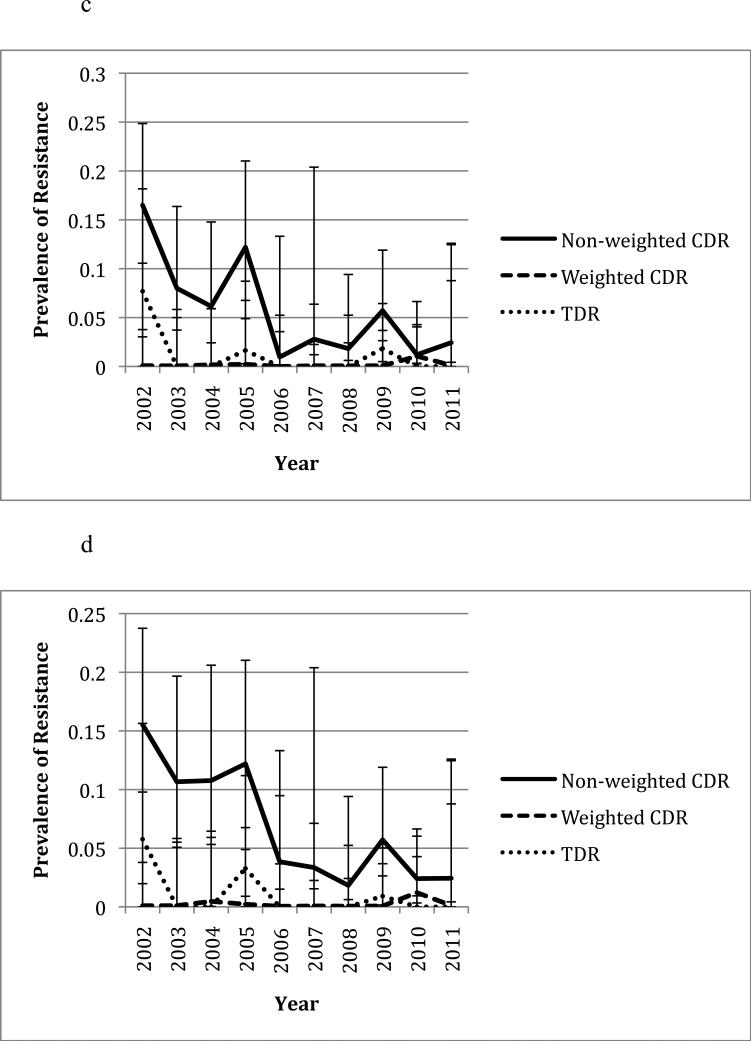
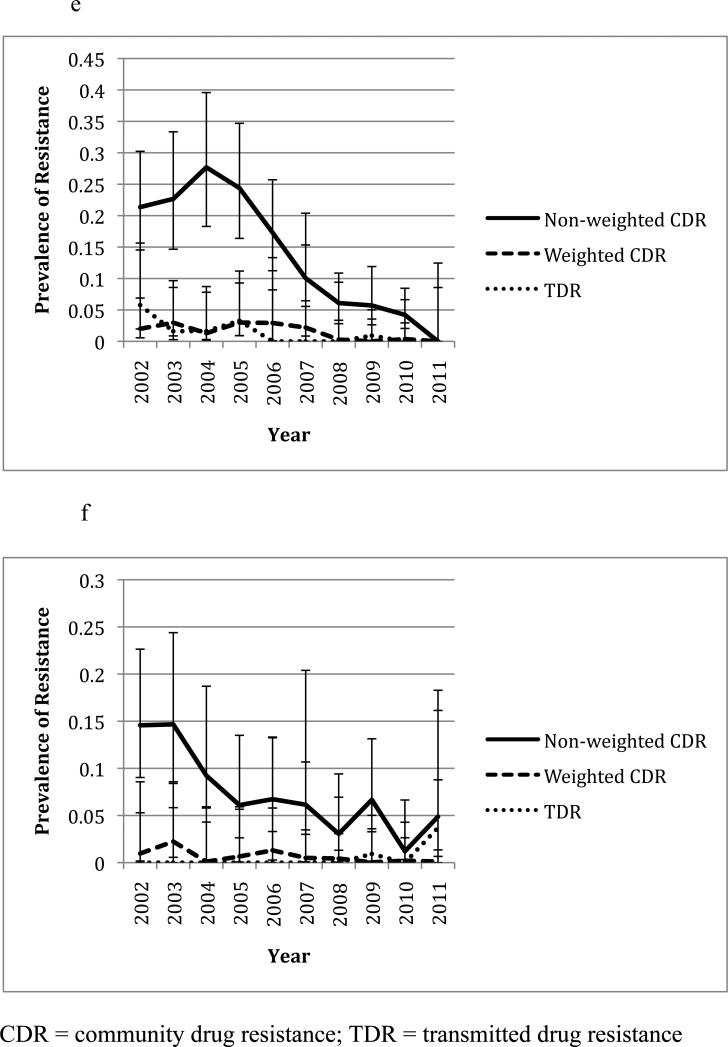
Figure 1.
Changes in prevalence of CDR and TDR over time at various resistance positions in HIV-1 RT and pro. Error bars represent 95% confidence intervals for each prevalence estimate. All years are included except for 2001 due to the low number of sampled individuals. The non-weighted CDR is the total prevalence of the resistance mutation in the Owen Clinic cohort, while the weighted CDR has been adjusted based on the patient's viral load. CDR during the years 2002-2005 was compared to that during the years 2006-2011 at each position using a t-test (see p-values in parentheses).


