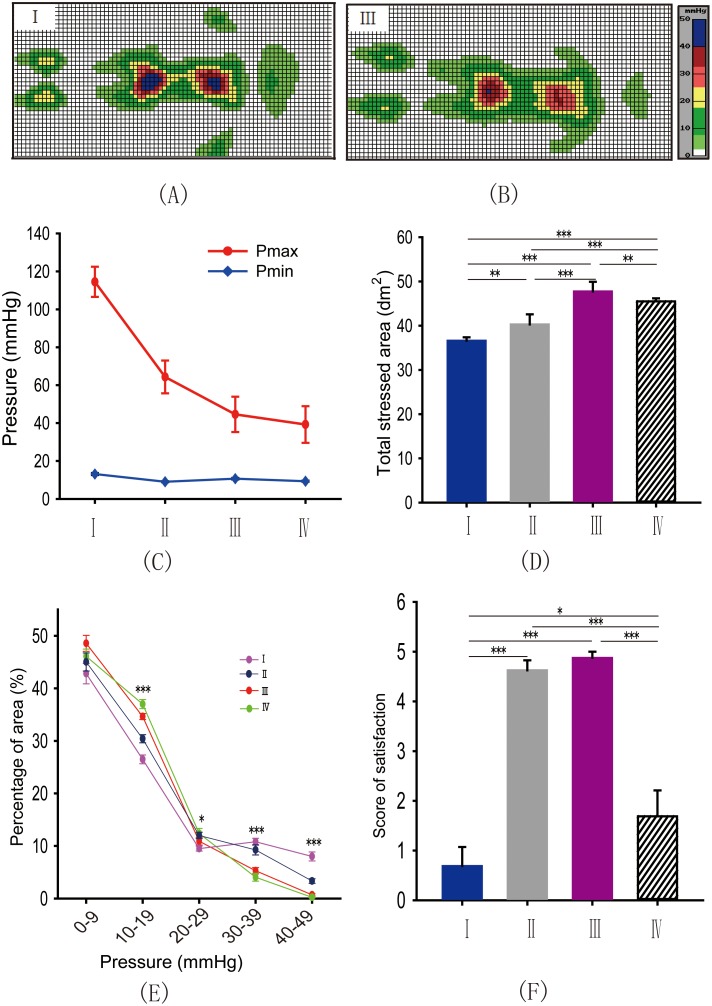
Figure 1. Four models of interface pressure distribution were identified by the different mattresses.
(A, B) Examples of the distribution area of pressure at different levels on two models I and III. (C, D) The mean Pmax, Pmin and total stressed area were significantly different between the four mattresses. (One way ANOVA and LSD test, Maximum pressure: P I*IV<0.05, P I*II<0.001, P I*III<0.001, P II*IV<0.05; Minimum pressure: P I*IV<0.001, P I*II<0.001, P I*III<0.001, P II*III<0.001; Total stressed area: P I*IV<0.001, P I*II<0.01, P I*III<0.001, P II*IV<0.001, P III*IV<0.01, P II*III<0.001). (E) Significant differences in the percentage of area in blocks of 10–19 mm Hg, 20–29 mm Hg, 30–39 mm Hg and 40–49 mm Hg existed between the four mattresses. (One way ANOVA and LSD test, 10–19 mm Hg: PI*IV<0.001, P I*II<0.001, P I*III<0.001, P II*IV<0.001, P III*IV<0.05, P II*III<0.001; 20–29 mm Hg: P I*IV<0.01, P I*II<0.05; 30–39 mm Hg: P I*IV<0.001, P I*II<0.001, P III*IV<0.001, P II*III<0.001; 40–49 mm Hg: P I*IV<0.05, P I*II<0.05, P I*III<0.05, P II*IV<0.05, P II*III<0.05); (F) Subjects showed higher scores of satisfaction for mattresses II and III compared to I and IV, but with no significant differences between mattresses II and III (Kruskal-Wallis one way ANOVA on Ranks and SNK test, P I*II<0.001, P I*III<0.001, P I*IV<0.05, P III*IV<0.001, P II*IV<0.001). *P<0.05; **P<0.01; ***P<0.001.

