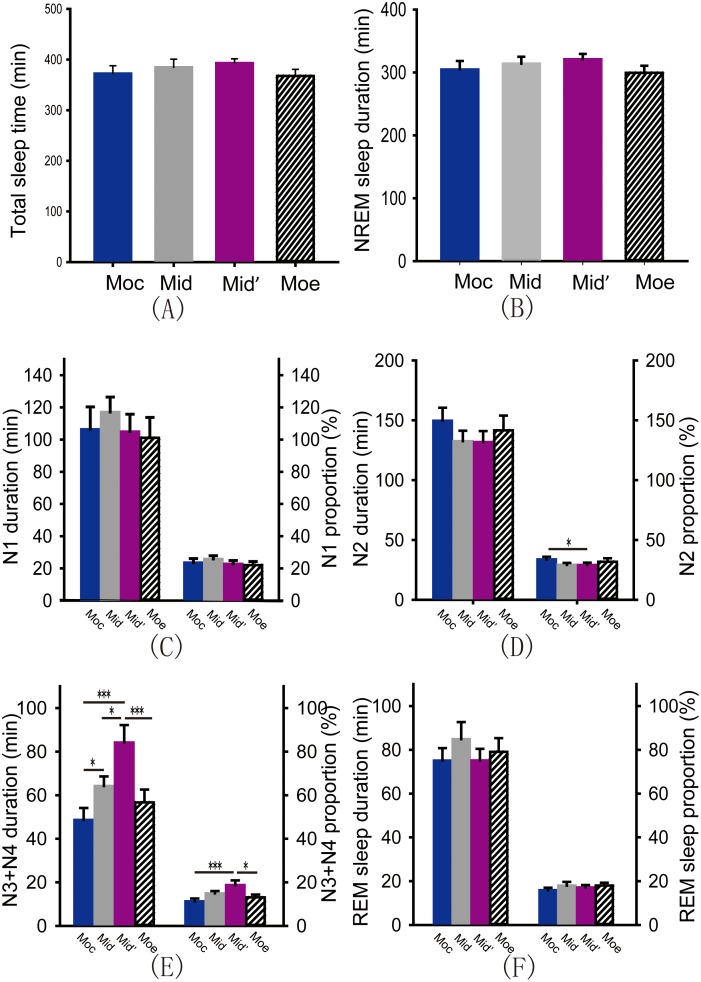
Figure 3. Duration and proportions of different sleep stages under four kinds of pressure distribution models.
(A) Total sleep time (all P>0.05). (B) NREM sleep duration (all P>0.05). (C) Duration and proportion of N1 (all P>0.05). (D) Duration and proportion of N2 (Paired t test, P Moc*Mid′<0.05). (E) Duration and proportion of N3+N4. (One way ANOVA and LSD test, duration: P Moc*Mid<0.05, P Moc*Mid′<0.001, P Moe*Mid′<0.001, P Mid*Mid′<0.05; proportion: P Moc*Mid′<0.001, P Moe*Mid′<0.05). (F) Duration and proportion of REM sleep (all P>0.05). **P<0.01; *P<0.05; ***P<0.001.

