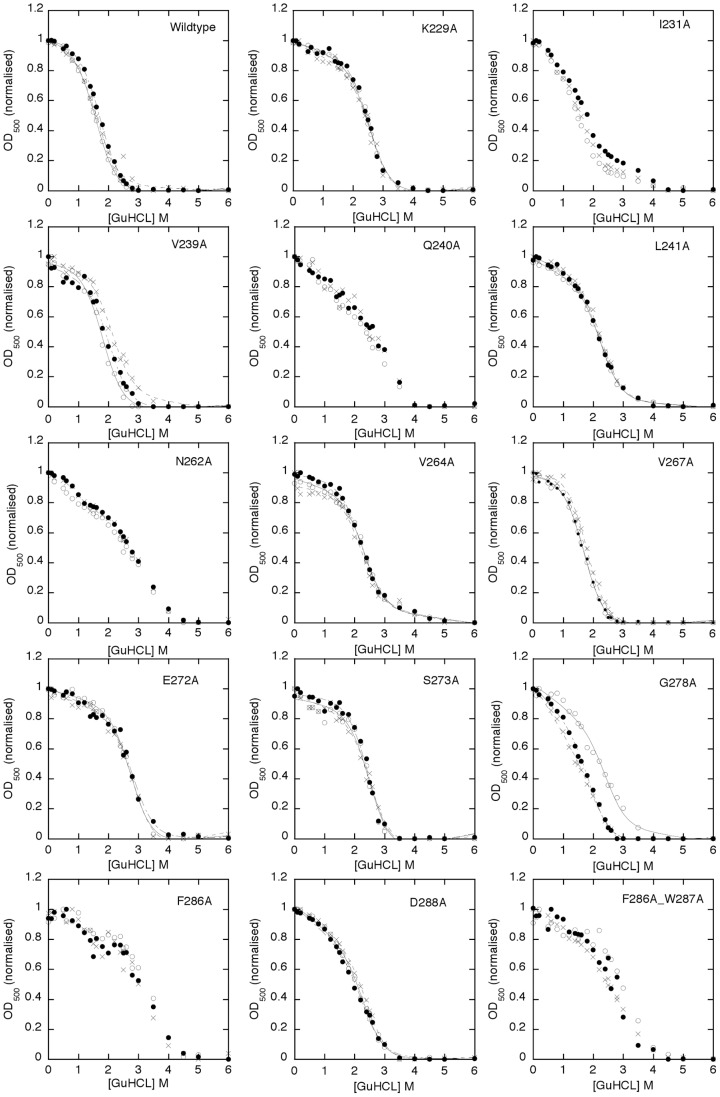
Figure 5. GuHCl unfolding measurements of HET-s(218–289) amyloid fibrils and Ala variants thereof.
The GuHCl denaturation curve of amyloid fibrils of HET-s(218–289) and Ala variants (as indicated) were measured by the OD500 (y-axis) at various GuHCl concentration (x-axis) after incubation in the corresponding GuHCl buffers for one day. The change of the OD500 value is indicative of the loss of large aggregated protein species. Three samples each were incubated and the individual measurements are highlighted by asterisks, by small dots, or by open circles, respectively. Individual successful fits following the concept by Santoro and Bolen to study protein folding and unfolding [61] are shown by black lines and the calculated change in Gibbs energy (ΔG) with its standard deviation from the three measurements are listed in Table 3.

