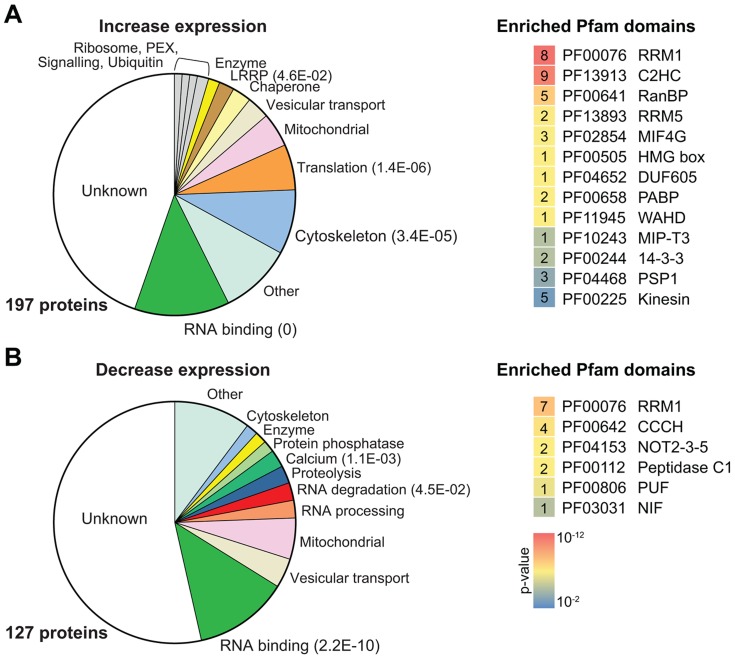
Figure 4. Enriched protein categories and Pfam domains.
(A) Proteins for which fragments increased BLA resistance are classified by category. Different classes of gene function are shown in different colors. For highly enriched groups (Fisher's exact test, P<0.05) the E-values are shown in parentheses. On the right, all Pfam domains that were significantly enriched are shown (P<0.01, Fisher's exact test); lower p-values are represented in red, higher p-values are represented in blue. The numbers of each domain identified are shown in the corresponding boxed. (B) Proteins for which fragments suppressed PGKB expression. Details are as in (A).

