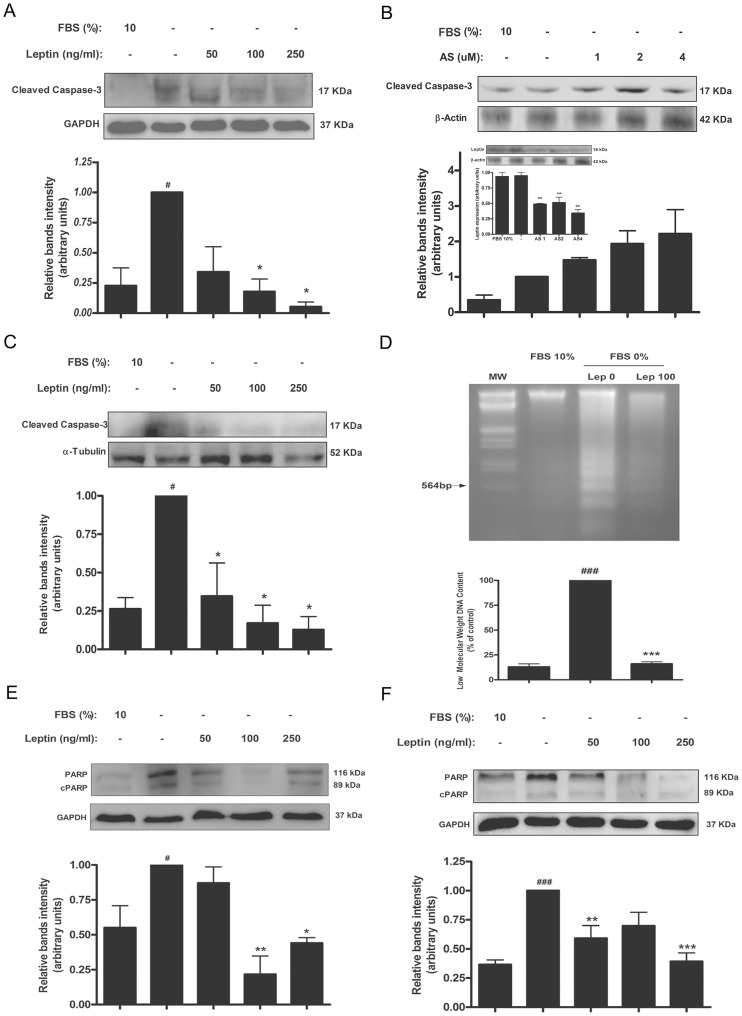
Figure 1. Leptin prevents apoptosis in placental cells.
Caspase activity was determined in BeWo cells (A and B) or placental explants (C). A–B) BeWo (1×10⁶ cells) were plated in complete DMEM-F12 media (10% FBS). After 24 h cells were incubated during 72 h in DMEM-F12 0% FBS, with increasing doses of leptin (A) or an oligonucleotide complementary to leptin sequence (AS) (B), as indicated in the figure. Cell extracts were prepared as indicated in Materials and Methods and proteins were separated on SDS-PAGE gels. The inset shows representative blots and quantification confirming reduced leptin expression in AS treated cells. C) Placental explants were processed as described in Material and Methods and incubated in DMEM-F12 0% FBS media supplemented with increasing leptin doses during 24 h. Placental extracts were prepared and proteins were separated on SDS-PAGE gels. Caspase-3 cleaved fragment was determined by Western blot analysis (A, B and C). D) Gel electrophoresis of apoptotic DNA fragmentation. Inspection of electrophoretic profiles revealed a lower ladder formation in presence of leptin. Quantification of low molecular weight bands is shown. DNA fragmentation assay was performed as indicated in Materials and Methods. E) Swan-71 cells (1×10⁶ cells) were plated in complete DMEM-F12 media (10% FBS). After 24 h cells were incubated during 72 h in DMEM-F12 0% FBS, with increasing doses of leptin as indicated in the figure. Cell extracts were prepared as indicated in Materials and Methods and proteins were separated on SDS-PAGE gels. F) Placental explants were processed as described in Material and Methods and incubated in DMEM-F12 0% FBS media supplemented with increasing leptin doses during 24 h. Placental extracts were prepared and proteins were separated on SDS-PAGE gels. In both cases (E and F) cleaved PARP (cPARP) fragment was determined by Western blot analysis. Cells cultured with DMEM-F12 media supplemented with 10% FBS were used as control. Molecular weights were estimated using standard protein markers. Molecular mass (kDa) is indicated at the right of the blot. Loading controls were performed by immunoblotting the same membranes with anti-β-actin, anti-α-tubulin or anti-GAPDH. Bands densitometry is shown in lower panels. Results are expressed as mean ± SD for three independent experiments. Statistical analyses were performed by ANOVA and Bonferroni's multiple comparison post hoc test, relative to FBS 10% (#) or FBS 0% (*). # p<0.05, ###p<0.001, * p<0.05, ** p<0.01, ***p<0.001.

