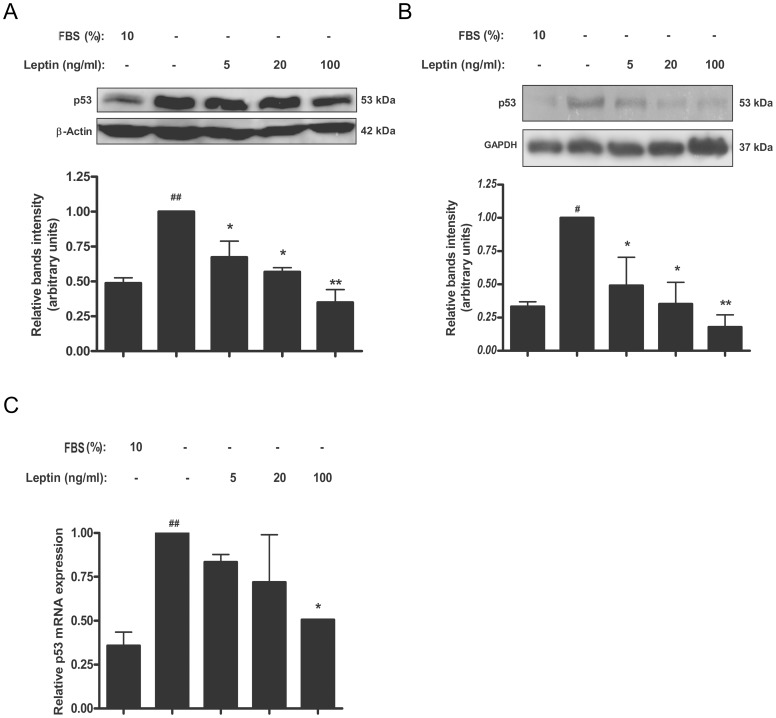
Figure 5. Leptin reduces p53 levels in placenta.
A) Swan-71 cells (1×10⁶ cells) were plated in DMEM-F12 media in the absence of serum and incubated during 72 h with different leptin concentrations. Cell extracts were prepared as indicated in Materials and Methods and proteins were separated on SDS-PAGE gels. B) Placental explants were processed as described in Material and Methods and incubated in DMEM-F12 media supplemented with increasing leptin doses during 24 h. Placental extracts were prepared and proteins were separated on SDS-PAGE gels. In both cases (A and B) p53 was determined by Western blot analysis. DMEM-F12 10% FBS was used as a control. Molecular weights were estimated using standard protein markers. Molecular mass (kDa) is indicated at the right of the blot. Loading controls were performed by immunoblotting the same membranes with anti-α-GAPDH. Bands densitometry is shown in lower panels. Results are expressed as mean ± SD for three independent experiments. C) p53 expression in human placental explants was determined by qRT-PCR. RNA was extracted as described in Materials and Methods. Statistical analyzes were performed by ANOVA. Asterisks indicate significant differences from the control according to Bonferroni's multiple comparison post hoc test, relative to FBS 10% (#) or FBS 0% (*). # p<0.05, ## p<0.01, * p<0.05, ** p<0.01.

