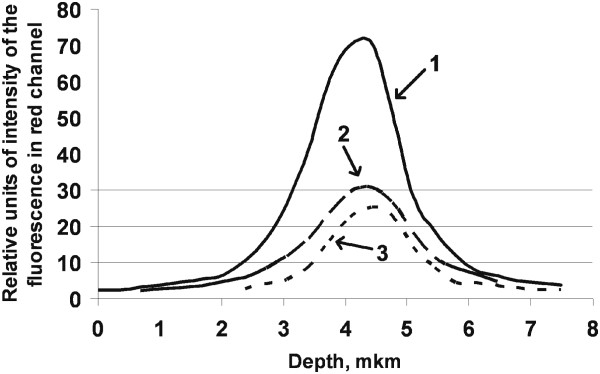
Figure 7.

Distribution of TRITC-phalloidin fluorescence intensity, measured at different depths of the mesenchymal stem cells (z-stacks). Fluorescence intensities in the control group (curve #1) and after cultivation with Si (curve #2) and SiB nanoparticles (curve #3) normalized according to their maximum values. No peaks of Gaussian distribution shifted. This finding is highly suggestive of even distribution of actin filaments across the depth of a cell in all study groups.
