Fig. 2.
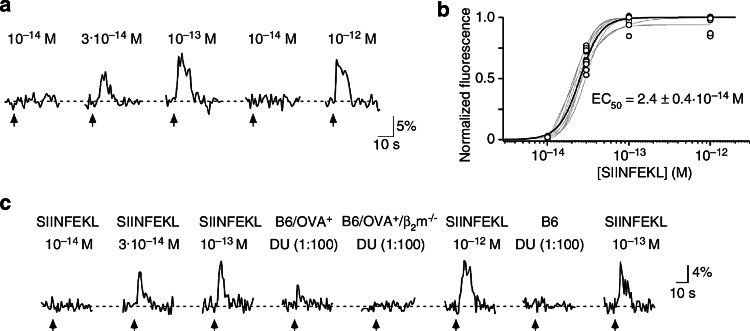
Analysis of peptide and urine-evoked Ca2+ responses in intact VSNs. a Example of somatic Ca2+ recordings from a single VSN to different concentrations of SIINFEKL. A response is defined as a stimulus-dependent deviation in Ca2+ fluorescence that exceeds twice the standard deviation of the mean of the baseline fluorescence noise. b SIINFEKL dose–response curves (grey) each recorded from a single VSN (n = 12 cells, eight slices). Relative changes in peak fluorescence (ΔF/F) induced by a given stimulus were normalized to the maximum peak response measured in a given VSN to construct a dose–response curve. The black curve represents the mean dose–response curve; EC50 value and SD are indicated. c Comparison of Ca2+ responses in a single VSN to various concentrations of SIINFEKL and urine (DU, diluted 100-fold to simulate the decrease in concentration in the VNO duct) obtained from B6/OVA+, B6/OVA+/β2m−/−, and B6 mice. This figure is taken from Sturm et al. [34], where further details can be found. Reprinted by kind permission of Trese Leinders-Zufall

