Fig. 5.
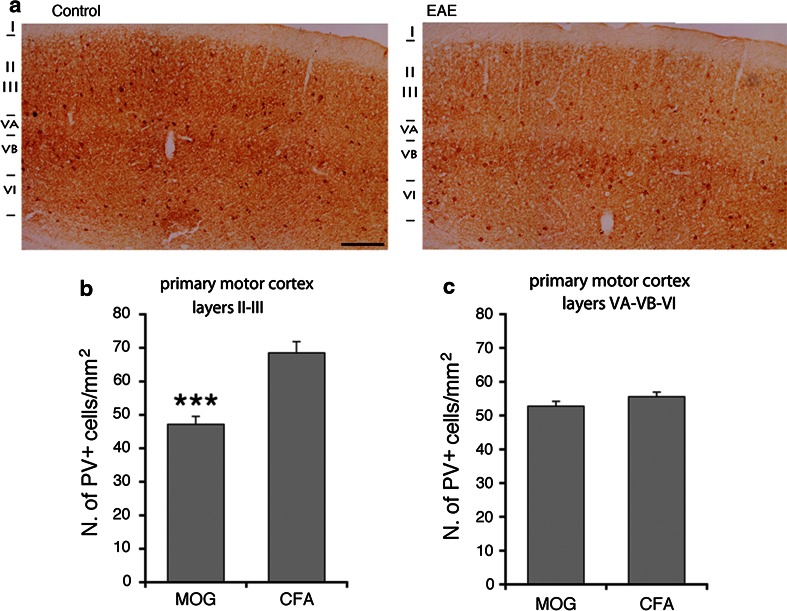
EAE causes the reduction in PV-positive interneurons in layers II–III of the M1. a PV staining of the M1 of EAE mice with high clinical score (right) and control mice (left). Scale bar, 200 μm. b Number of PV-positive neurons/mm2 in layers II–III of the M1 from EAE mice with elevated clinical score and control mice. c Number of PV-positive neurons/mm2 in layers V–VI of the M1 from EAE mice with pronounced clinical score and control mice. Graph bars are normalized means ± SEM (n = 30 sections from 5 mice/experimental condition). ***P < 0.001

