Fig. 9.
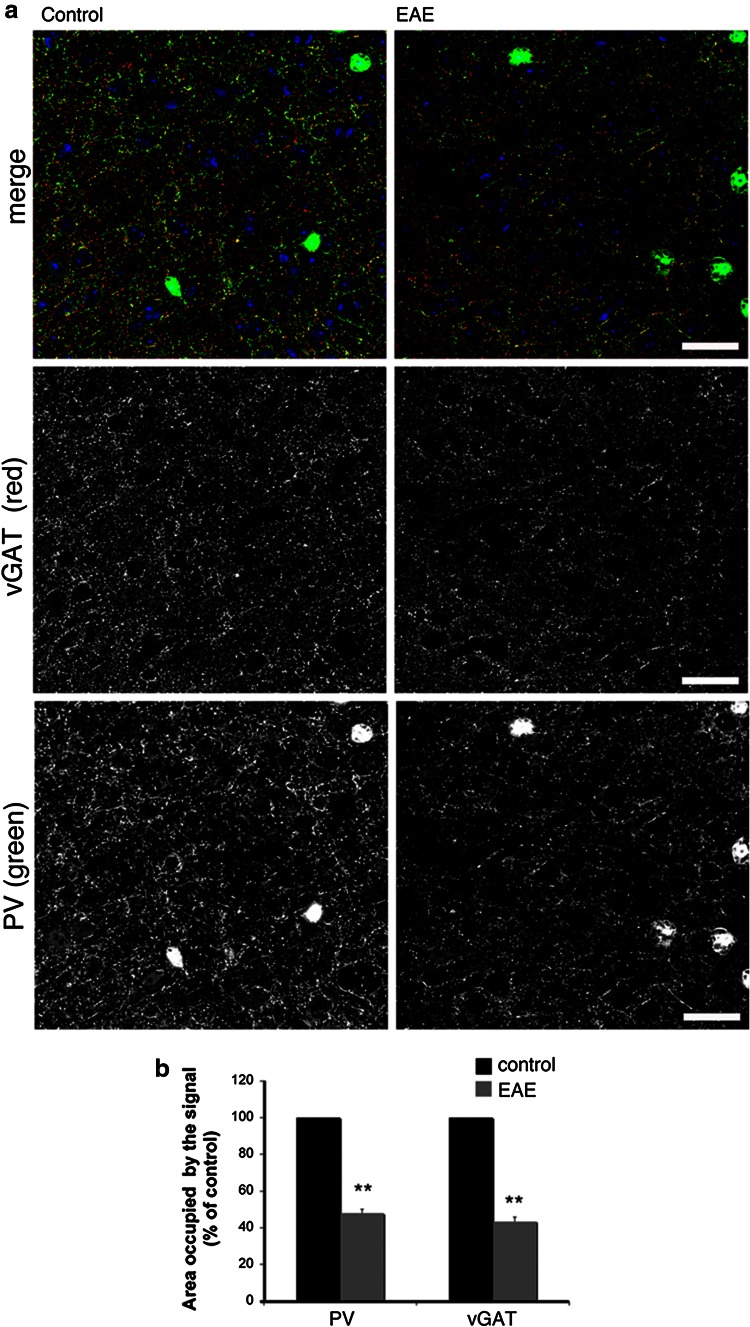
The inhibitory presynaptic input is reduced in the M1 of EAE mice. a Confocal images of layers II–III of the M1 immunostained for the presynaptic marker vGAT (red), PV (green) and DAPI (blue). Scale bars, 50 μm. b Reduction of the signal for both PV and vGAT in layers II–III of the M1 of EAE and control mice. Graph bars are normalized mean ± SEM (n = 26 cortical fields from 3 mice/experimental condition). **P < 0.005

