
Figure 1.
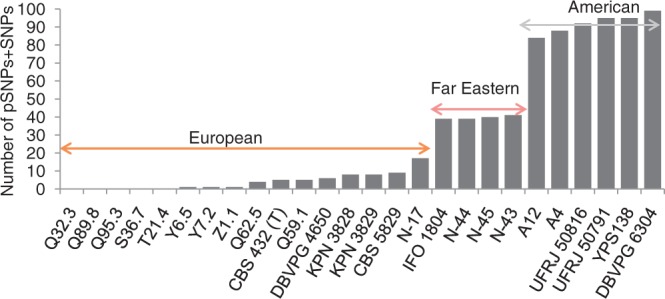
pSNP + SNP polymorphism counts in S. paradoxus strains. Bar chart of pSNP plus SNP variation in each S. paradoxus strain, labeled to show the split into distinct populations. The strains are ordered by increasing number of pSNPs + SNPs, and naturally split into the three geographical locations.