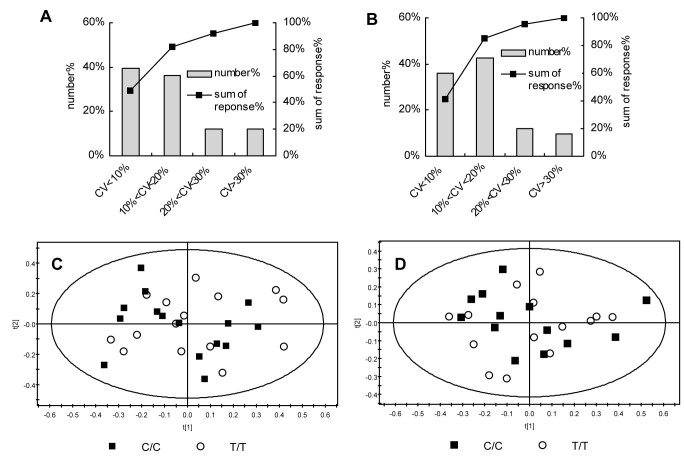
Figure 2. Analytical robustness and reproducibility of non-targeted metabolomics evaluated using QC samples and metabolite fingerprints of homozygous T-allele TCF7L2 rs7903146 carriers (n = 15) and homozygous C-allele carriers (n = 15) by principle component analysis (PCA).
(A) and (B) shows coefficient of variation (CV) distribution in QC samples in ESI(+) and ESI(-) mode, respectively. Number%, percentage of ions with CV within a specific range as indicated in X axis. Sum of response%, percentage of sum of response of ions below a criterion. (C) shows the PCA overview of the metabolite fingerprints detected in the positive ionization mode ESI (+). Each individual fingerprint is composed out of 3083 metabolite ions. (D) shows the PCA overview of the metabolite fingerprints detected in the negative ionization mode ESI (−). Each individual fingerprint is composed out of 962 metabolite ions.

