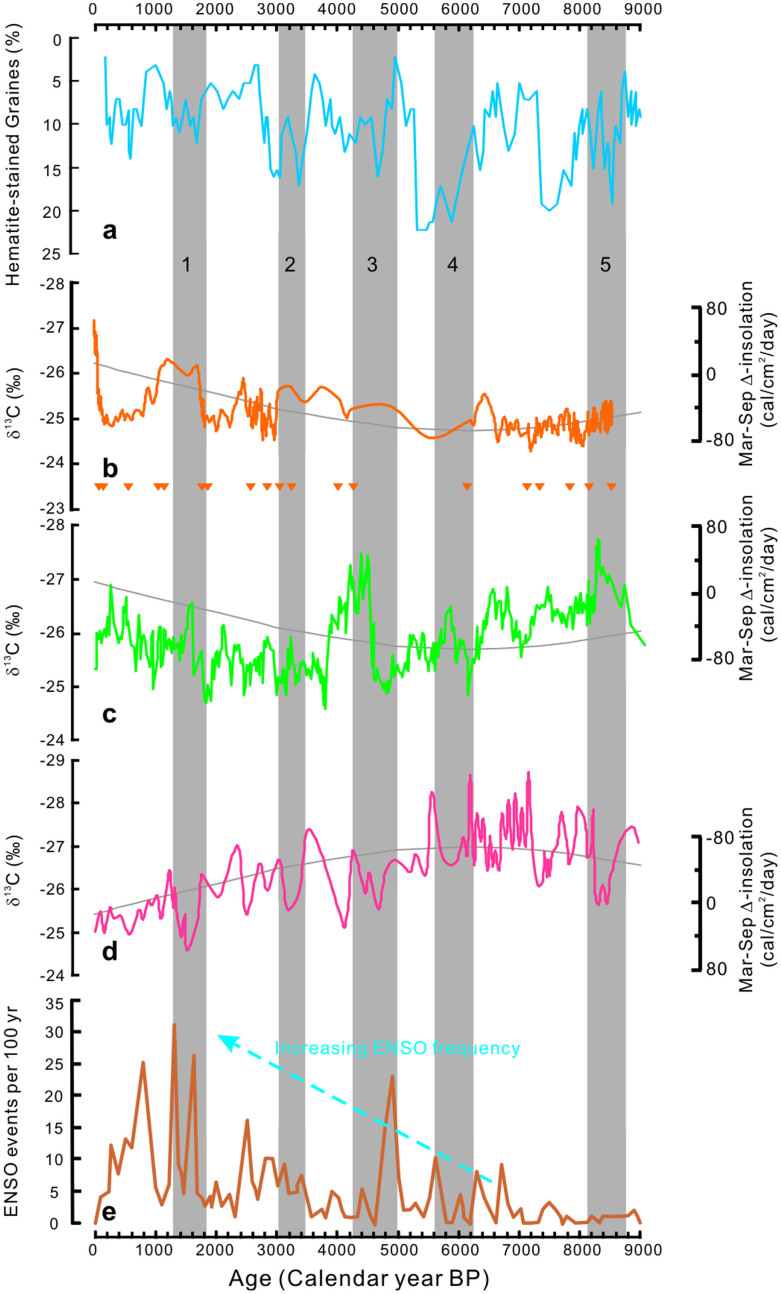
Figure 5. The comparison of summer rainfall in eastern-Central Asia (b), the intensity of the East Asian summer monsoon23 (c) and the Indian summer monsoon21 (d), the climate variation of the high northern latitudes27 (a), and the El Niño/Southern Oscillation (ENSO) frequency in the equatorial Pacific60 (e).
The grey bars trace the teleconnection among these variables on the millennial timescale. The orange triangles show the calibrated 14C age-control points of the Chaiwobu time series. The numbers from 1 to 5 indicate the five ice-rafted debris (IRD) events of the North Atlantic27. The grey curve shows the solar radiation difference between March and September at the equator as a measure of seasonality in the cold tongue of the eastern Equatorial Pacific45.

