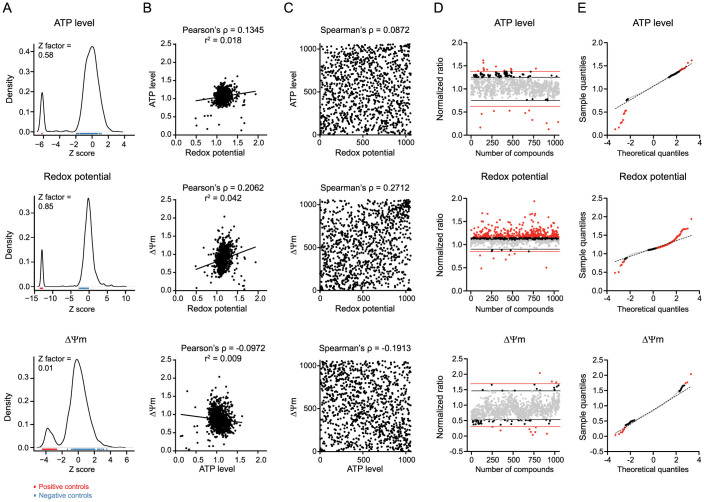
Figure 3. Screening of 1,200 FDA approved drugs in the Hepa1.6 cell line.
(A–E) Screening of the Prestwick library of FDA approved drugs, using the three basal assays and oxidative cell culture conditions, i.e. low glucose concentration (1 g/l), supplementation with oleic acid at 30 μM and cell density of 95% the day of the assays. (A) Cell-based assays screening separation bandwidth. Plots represent the cumulative density of points over Z scores of the raw values for all the points of the screening, including negative (blue points) and positive controls (red points) and samples. The redox potential assay has the best separation capacity with narrow peaks of negative and positive controls on the density plot and a Z factor close to 1. (B–C) Correlations between the three cell-based assays show poor level of relationship between the different parameters. (B) Pearson's ρ correlation coefficients and their corresponding regression r2 value were calculated for normalized ratios of the three parameters. (C) Spearman's ρ correlation coefficient was calculated for the correlation between rank orders of every parameter. (D) Graphs represent the normalized ratio calculated as described in the materials and methods section. The black lines delimit the zone of compounds inducing a change inferior to DMSO ± 2σDMSO, and the red lines the zone of compounds inducing a change superior to DMSO ± 3σDMSO. (E) Graphs represent the quantile-quantile (QQ) plots, plotting the theoretical quantiles for each assay in x-axis over the normalized ratio in y-axis. The grey points correspond to compounds inducing a change inferior to DMSO ± 2σDMSO, the black points to a change comprised between DMSO ± 2σDMSO and DMSO ± 3σDMSO, and the red points to a change superior to DMSO ± 3σDMSO.

