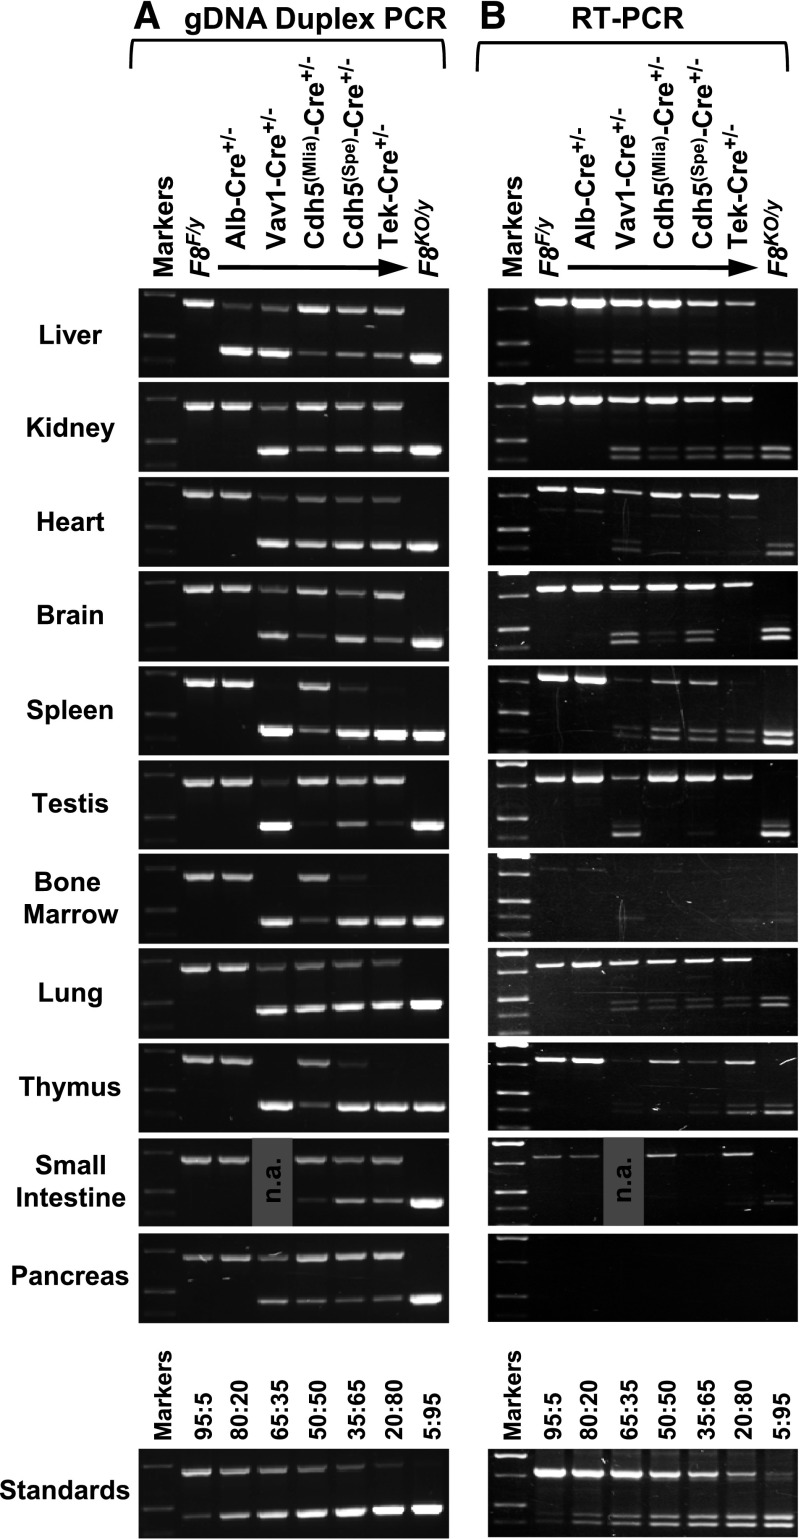
Figure 4.
Analysis of tissue gDNA and mRNA. Tissue samples were collected from males following whole-animal saline perfusion. DNA and total RNA were isolated from the same tissue sample and analyzed by allele-specific PCR. Except for the F8KO/y mouse, all animals inherited a F8F/y genotype, either without Cre or with coinheritance of a Cre transgene as indicated. (A) A total of 25 ng of gDNA was amplified using a duplex PCR that yields a 712-bp F8F allele-specific product and a 462-bp F8KO allele-specific product. Primer P1, P2, and P3 binding sites are shown in Figure 1B-C. (B) For RT-PCR, 100 ng of total RNA was reverse transcribed and then analyzed by PCR using primers P4 and P5, which span the exon 17/18 deletion cassette (as shown in Figure 1D). An 819-bp product is amplified from the F8F allele, representing normally spliced F8 mRNA. For the F8KO allele, in addition to the 407-bp product predicted for exon 16/19 mRNA splicing (F8KO(16/19)), a 453-bp product is also present due to alternative splicing (F8KO(Alt)). The “Standards” panels consist of PCR products amplified from defined mixtures of F8F/y and F8KO/y liver gDNA (panel A) or total RNA (panel B) at various ratios as indicated (F8F:F8KO). n.a. indicates a sample that was not analyzed.

