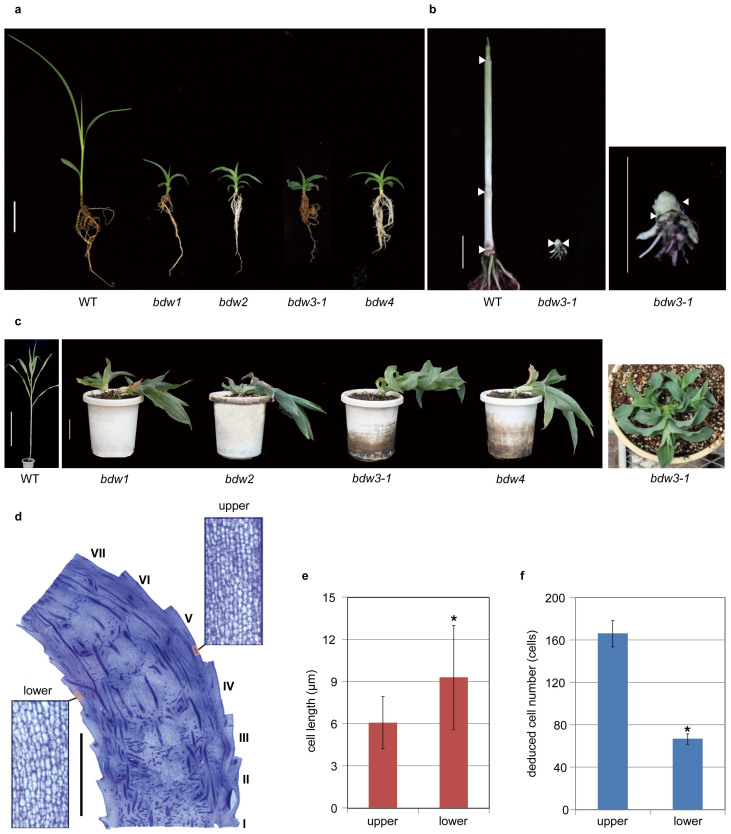
Figure 1. Phenotypic analysis of the bdw mutants.
(a) The bdw and WT plants at the seedling stage (30 days after germination, DAS). Bar = 4 cm. (b) Culm structure of WT (left) and bdw3 (center and right) at the vegetative stage. Bars = 2 cm. Nodes are indicated by arrowheads. (c) WT and the bent bdw mutants at the vegetative stage (110 DAS). Top view of two-month old bdw3 is shown at the rightmost panel. Bars: 50 cm, WT; 4 cm, mutants. (d) Longitudinal section of bdw3 culm. Roman numerals at the right side indicate internode position from bottom to top. Bar = 5 mm. (e–f) The length and number of cells at the upper and lower sides of the fifth internode in the bent region shown in panel (d). Error bars for cell length represent the standard deviation calculated from approximately 100 cells. Error bars for cell number represent the standard deviation calculated from 5 cell files (see Methods). Asterisks indicate significant differences at 0.1% (P<0.001).

