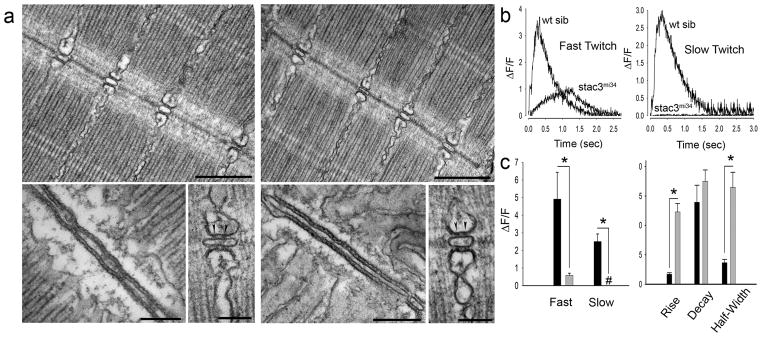
Fig. 2. EC Coupling is Defective in mi34 Mutant zebrafish Embryos.

Electron micrographs showing that the ultrastructure of myofibrils and triadic junctions are comparable between the muscles of 4 dpf wt sibling (a, left) and mi34 mutants (a, right). Top: Longitudinal sections showing several myofibrils and triads sectioned at right angle to the T tubule long axis. Scale: 500 nm. Bottom: at left a section tangent to the triad, showing one of the two long rows of feet (RyR) that occupy the junctional gap. Scale: 250 nm. Bottom: at right a section transverse to the triad axis showing two feet (arrowheads) in the junctional gap of the triad. Scale: 100 nm. (b) Ca2+ transients recorded from GCaMP3 expressing fast and slow twitch fibers are significantly decreased and slower in 48 hpf stac3mi34 mutants. (c) Left: quantification of peak Ca2+ release with black and gray bars representing wt sib (fast, n=5; slow, n=5) and stac3mi34 (fast, n=9; slow, n=7) fibers, respectively. # denotes that peak Ca2+ was 0. Right: quantification of Ca2+ transient kinetics in fast fibers with black and gray bars representing wt sib and stac3mi34, respectively. Half width denotes the duration the transient is greater than 50% of peak value. Error bars represent standard error of the means. Asterisks signifies p<0.01, t-test.
