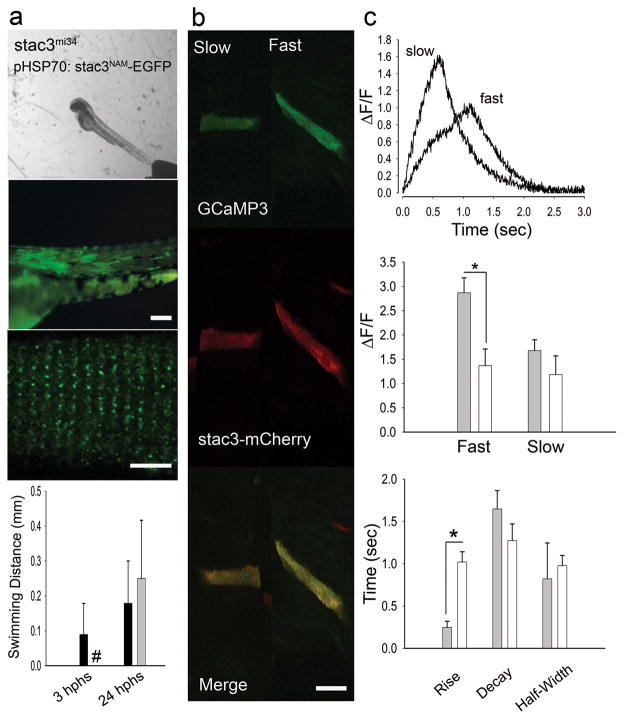
Fig. 8. The stac3NAM Allele Decreases EC Coupling.
(a) Expression of Stac3NAM by muscle fibers in stac3mi34 embryos does not rescue touch evoked swimming. Superimposed frames (30 Hz) showing that a heat induced mutant embryo previously injected with pHSP70:stacNAM-egfp does not swim following tactile stimulation (top) despite expression of zebrafish Stac3NAM-EGFP in myotomes and triadic localization of zebrafish Stac3NAM-EGFP (middle, scale bars: 180 μm and 10 μm). Histograms (bottom) quantify the comparable lack of touch evoked swimming of stac3mi34 mutants expressing the NAM allele (black) and uninjected mutants (gray) both 3 and 24 hphs. Note the difference in scale of the y axis from that in Fig. 4a that shows swimming in mutant rescued embryos. # denotes zero movement. (b) Expression of Stac3NAM by muscle fibers in stac3mi34 embryos partially rescues Ca2+ transients in vivo. Left panels, examples of stac3mi34 mutant slow and fast twitch fibers co-expressing α-actin driven GCaMP3 and hsp70 regulated zebrafish Stac3NAM-mCherry. The triadic localization of Stac3wt-mCherry cannot be seen due to the low resolution of the resonance scans used to detect the fluorescent proteins. (c) top, Ca2+ transients from mutant fast and slow fibers co-expressing Stac3NAM-mCherry and GCaMP3. Right middle, histogram showing that peak Ca2+ release is decreased between mutant fast fibers expressing stac3wt (gray, n=6) and stac3NAM (white, n=6). Peak Ca2+ was not different for mutant slow twitch fibers (wt, n=2; NAM allele, n=2). Bottom, histogram showing the kinetics of Ca2+ transients of mutant fast fibers expressing stac3wt (gray, n=5) and stac3NAM (white, n=9). Asterisk signifies p<0.01, t-test. Error bars represent standard error of the means.

