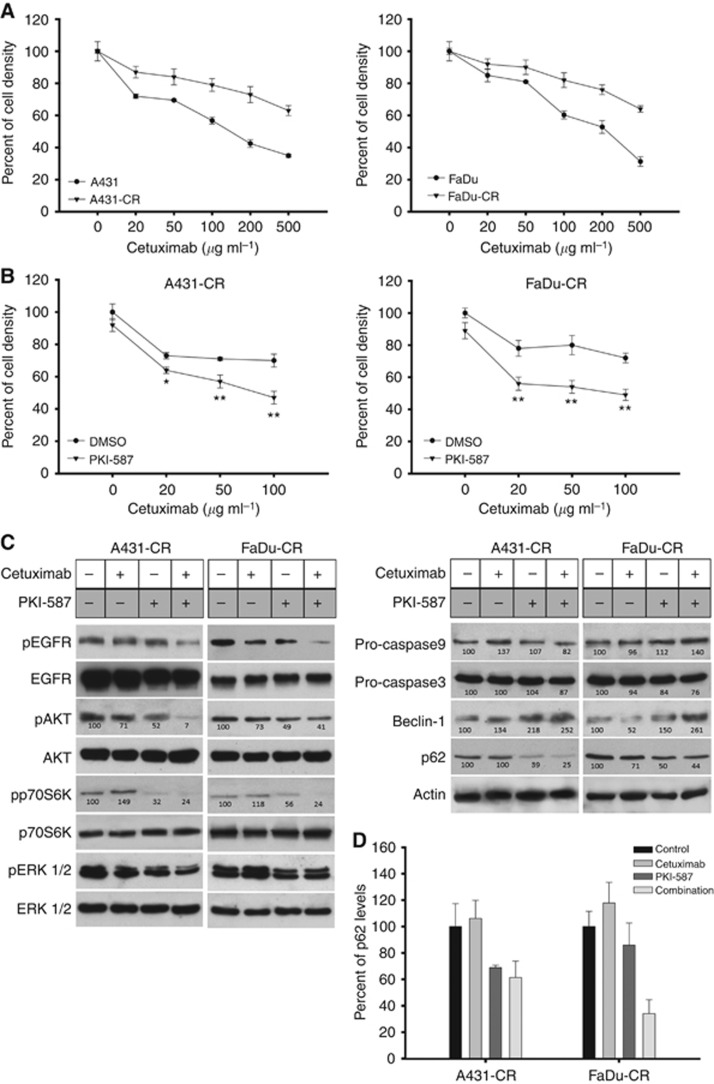
Figure 4.
Effects of cetuximab and PKI-587 combination on survival of cells with acquired resistance to cetuximab. (A) Percent of cell density of human squamous cancer cells with acquired resistance to cetuximab (A431-CR, FaDu-CR) treated with increasing doses of cetuximab (20–500 μg ml−1) compared with parental cells (A431, FaDu). Data represent the mean (±s.d.) of three independent experiments, each performed in triplicate. Error bars indicate s.d. values. (B) Percent of cell density of cetuximab-resistant cells (A431-CR, FaDu-CR) treated with increasing doses of cetuximab (20–100 μg ml−1) and combination with PKI-587 (0.5 nM), as measured by MTT assay. Data represent the mean (±s.d.) of three independent experiments, each performed in triplicate. Error bars indicate s.d. values. Asterisks indicate statistical significance of combined treatment vs single agent, as determined by Student's t-test (*, two-sided P<0.05; **, two-sided P<0.005). (C) Western blot analysis of protein expression in cetuximab-resistant cells treated for 24 h with cetuximab (200 μg ml−1), PKI-587 (50 nM) or their combination. Relative optical densities of phospho-protein levels or protein levels normalised to the total protein or actin level, respectively, are shown. Data represent the mean (±s.d.) of three independent experiments, each performed in triplicate, and are presented relative to control. (D) ELISA assay of p62 levels in cetuximab-resistant cells treated for 24 h with cetuximab (200 μg ml−1), PKI-587 (50 nM) or their combination. Values represent mean±s.d. from triplicate samples for each treatment. Error bars indicate s.d. values.

