Figure 1.
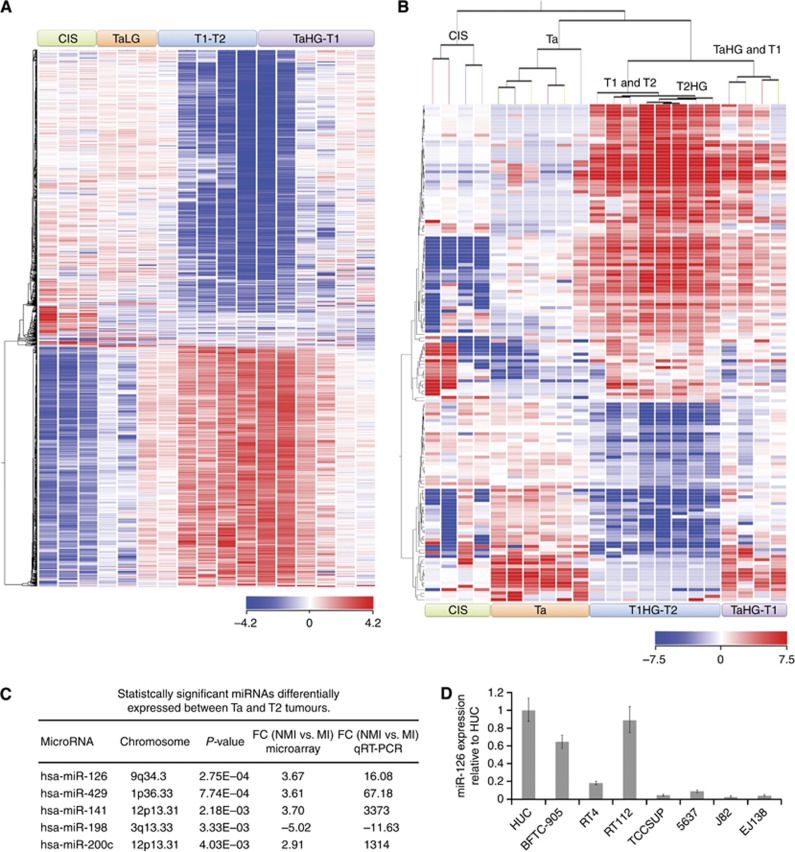
The mRNA and miRNA expression profiles cluster bladder cancer by pathological stage. (A) Samples are in columns and mRNAs are in rows. Samples are clustered according to the expression signature of 1493 differentially expressed mRNAs (P⩽0.05, fold change (FC) ⩾10). (B) Samples are in columns and miRNAs are in rows. Samples are clustered according to the expression signature of 150 differentially expressed miRNAs (P⩽0.05, FC ⩾2). (C) List of statistically significant miRNAs differentially expressed between Ta (non-muscle invasive, NMI) and T2 (muscle-invasive, MI) bladder tumours and their respective FC according to the microarray. The qRT–PCR validation was performed on bladder cancer cell lines. (D) The expression of miR-126 in normal urothelium (HUC) and different-stage bladder cancer cell lines via qRT–PCR. Expression levels are calculated as log2 fold change.

