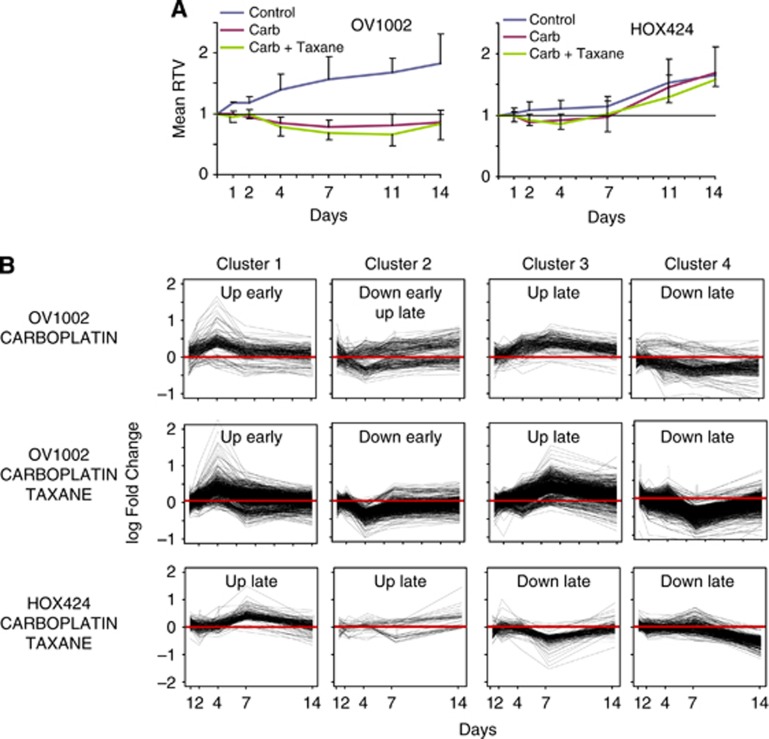
Figure 1.
Relative tumour volume (RTV) growth with respect to dynamic gene expression patterns. (A) Post-treatment tumour volume relative to day of treatment (day 0) for the OV1002 and HOX424 xenografts. (B) Mean expression change post-treatment of genes with similar temporal profiles in carboplatin- and carboplatin–paclitaxel-treated OV1002 and in carboplatin–paclitaxel-treated HOX424 xenografts.

