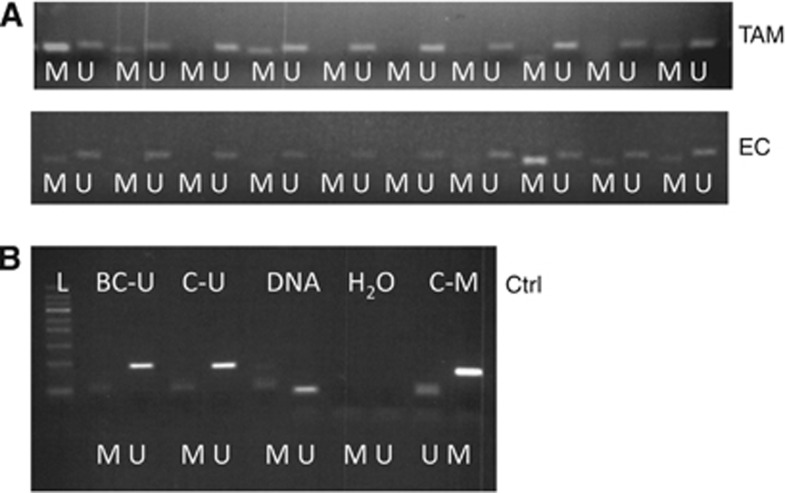
Figure 1.
Examples of MS-PCR analysis (A; showing the first lane of gels, including 10 patient samples of each group). ‘M' represents methylated bands and ‘U' unmethylated. Controls (B) were used at each analysis with BC-U being unmethylated human DNA that was bisulphite converted during sample workup procedures to assess the success of the conversion step. ‘C–U' and ‘C–M' were commercially available bisulphite converted unmethylated and methylated human DNA, respectively. ‘DNA' represents non-converted human DNA. The H2O samples were lacking DNA of any sort in the PCR mixture. Note that close to the bottom line of the ladder corresponding to about 50 bp, bands can be seen. These are primer dimers. The product bands for both ‘M' and ‘U' are around 100 bp with only minor differences.

