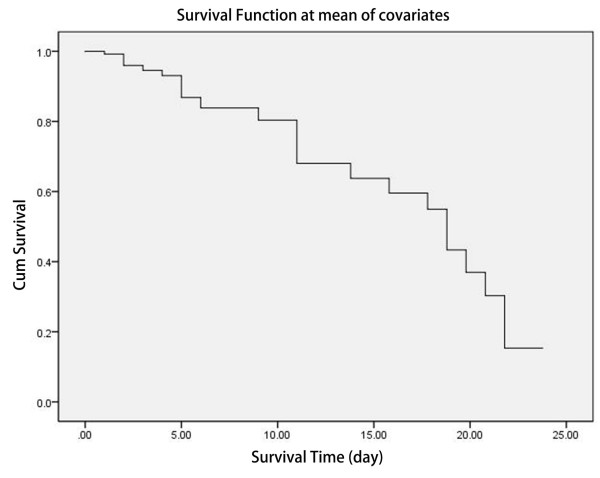
Figure 4.

Cumulative survival function at mean of covariates for survival analysis in infections complicated by congestive heart failure during 22 days hospitalization. The horizontal axis is survival time (days), and the vertical coordinate is the probability of survival at the corresponding times. This is a decline curve, which means the steeper the curve is, the shorter the survival time will be. The slope indicates the death rate.
