Figure 3.

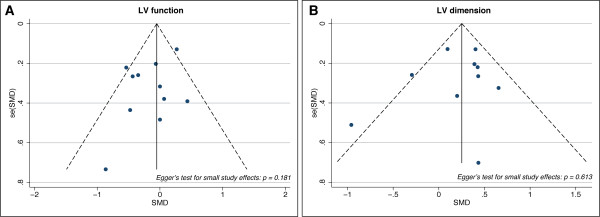
Funnel plot for small-study effects. Funnel plot showing possible publication bias due to small-study effects. (A) Funnel plot for LV function studies. (B) Funnel plot for LV dimension study.

Funnel plot for small-study effects. Funnel plot showing possible publication bias due to small-study effects. (A) Funnel plot for LV function studies. (B) Funnel plot for LV dimension study.