Figure 1.

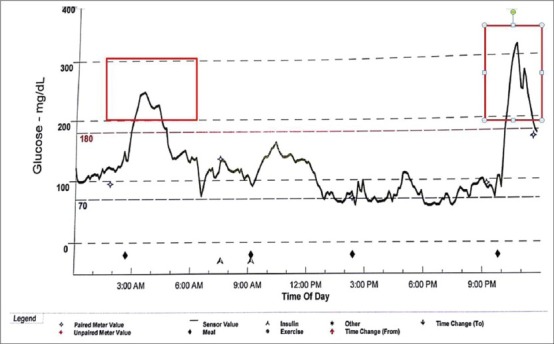
A CGM tracing one thalassemic patient with normal glucose tolerance (0 h = 98 mg/dl, 2h = 124 mg/dl) and twice abnormal (diabetic) postprandial blood glucose (red rectangles)

A CGM tracing one thalassemic patient with normal glucose tolerance (0 h = 98 mg/dl, 2h = 124 mg/dl) and twice abnormal (diabetic) postprandial blood glucose (red rectangles)