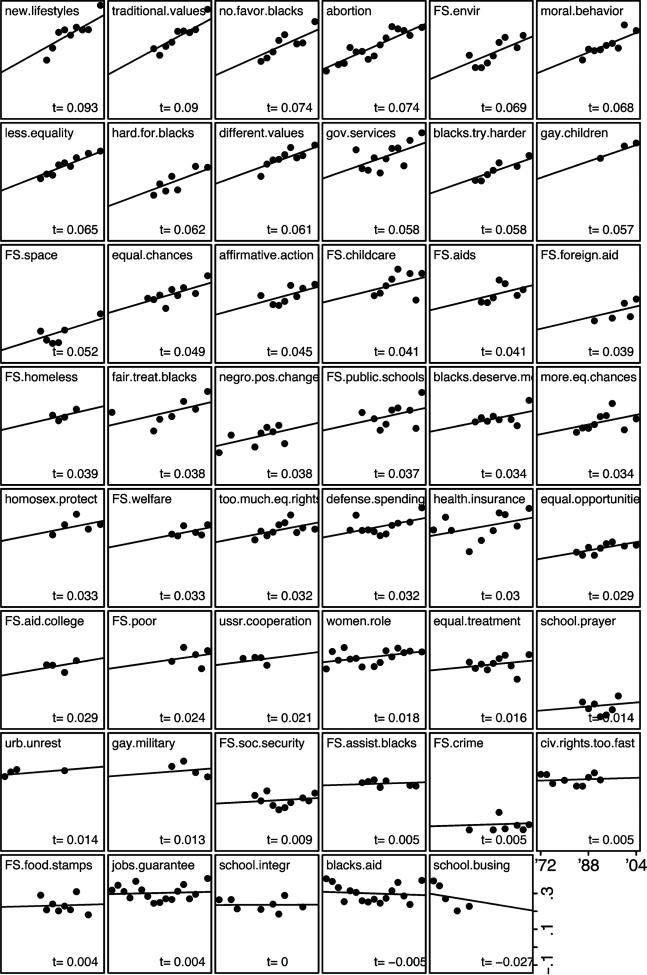
Fig. 4.
Trends in the correlation between issues and political ideology. Regression lines as estimated in equation (1); at the bottom of each plot is reported the coefficient ti. The x-axis is time (1972–2004), and the y-axis is correlation (–.1 to .5).

