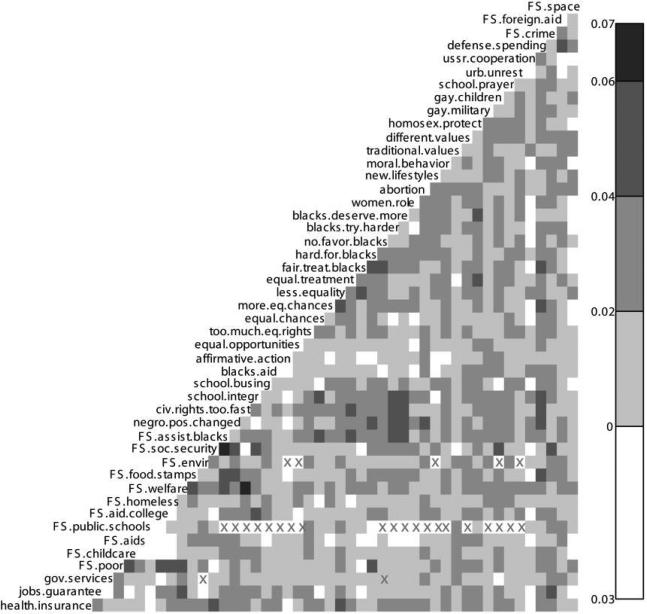
Fig. 7.
Time trends in correlations for all pairs of issues. The plot shows the trend estimates for each pair of issues from the multilevel model for issue alignment as estimated in equation (2) (a summary of the model is presented in table 3, model A). X's indicate pairs for which no observation was available (to compute the estimate, it was necessary for both issues in a pair to have been asked about in at least two different years).

