
Figure 1. Type I IFNs induce Trex1 expression in B6 cDCs.
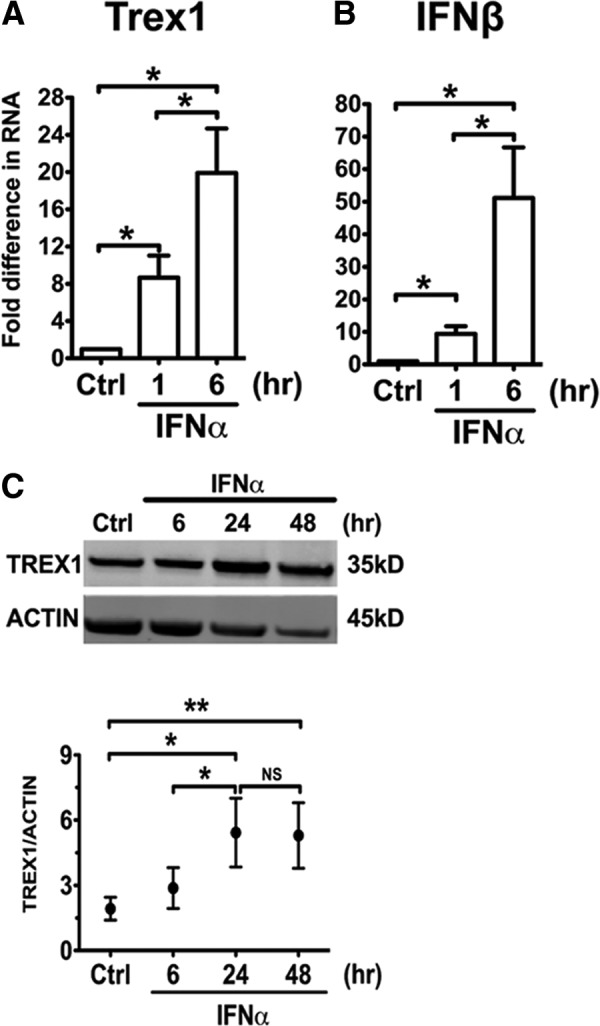
We stimulated B6 cDCs at Days 6–7 of culture, with or without IFN-α 1500 U/ml, and measured RNA expression of Trex1 (A) and IFN-β (B) by qRT-PCR after 1 or 6 h of stimulation. We normalized the results to the housekeeping gene cyclophilin and show fold differences compared with unstimulated B6 cDCs. Mean ± se are from four independent experiments. Ctrl, Control. (C) We measured by Western blotting protein levels of Trex1 in B6 cDCs after 6, 24, and 48 h of IFN-α stimulation. One representative blot is shown (upper), and Trex1 intensity values were normalized to β-actin (lower) and shown as mean ± se of three independent experiments, performed with three independent bone marrow-derived cultures, generated from three different mice.