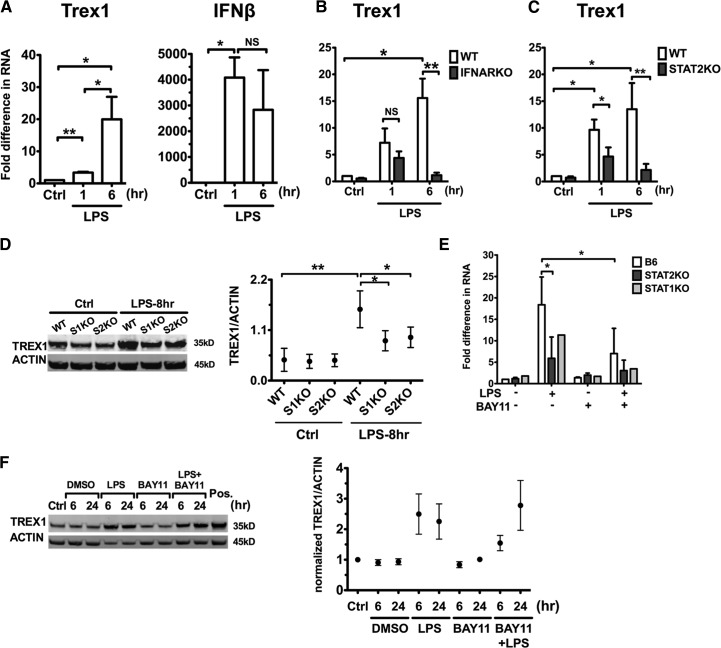
Figure 4. LPS induces Trex1 expression via a STAT1, STAT2, and IFNAR signaling pathway, as well as a NF-κB-dependent pathway.
We stimulated cDCs from B6 (A), IFNARKO (B), and STAT2KO (C) and WT mice with LPS 100 ng/ml and measured Trex1 and IFN-β RNA by qRT-PCR after 1 or 6 h of stimulation. Mean ± se are from five (A), four (B), and four (C) independent experiments. (D) Western blot analysis of Trex1 in WT and STAT1KO and STAT2KO cDCs, stimulated with LPS for 8 h. One representative blot and mean ± se of three independent experiments are shown. (E) Trex1 RNA of WT, STAT1KO, and STAT2KO cDCs, pretreated with NF-κB inhibitor BAY11 (10−6 M) for 15 min and then stimulated with LPS for 1 h. Mean ± se of three independent experiments of WT and STAT2KO and one representative experiment for STAT1KO are shown in E. (F) Trex1 protein levels of WT cDCs, pretreated with BAY11 and stimulated with LPS for 6 and 24 h. RAW 264.7 cell lysates were loaded as positive (Pos.) control, as they express high Trex1 proteins. One representative blot is shown. Protein levels of Trex1 were normalized to β-actin in D and F, and mean ± se from three independent experiments are shown.

