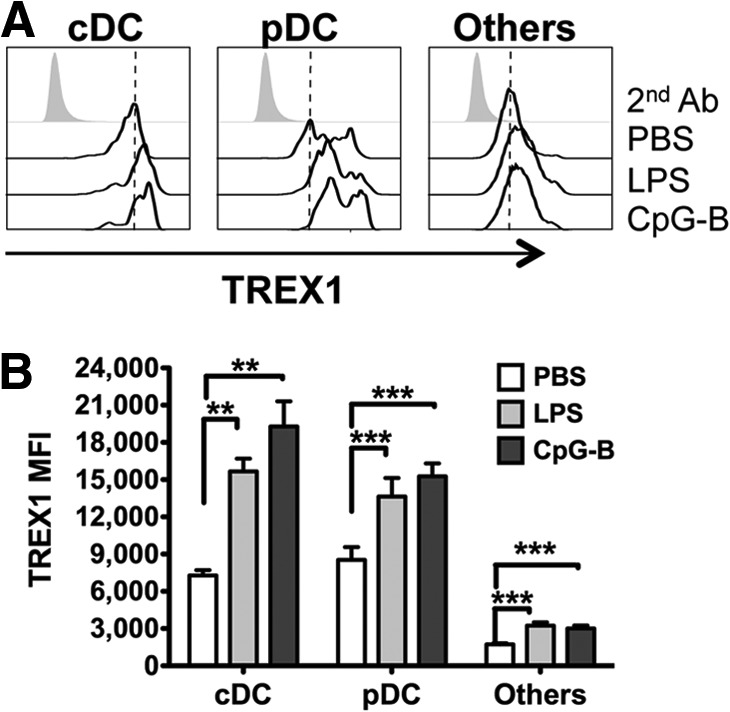
Figure 5. TLRs up-regulate Trex1 in vivo.

Intracellular staining of Trex1 in spleens from B6 mice injected i.p. with LPS, CpG-B, or PBS, 24 h earlier. (A) Representative histograms of Trex1 expression in different populations: cDC (CD11chighB220−), pDC (CD11clowB220+), and other cells (CD11c−B220−). 2nd Ab, Secondary antibody. (B) Mean ± se of Trex1 MFI (n=3 mice/group) in cDC, pDC, and other cells.
